Abstracts
The new Australian Fire Danger Rating System (AFDRS), is a nationally consistent approach to forecasting fire danger for all major vegetation types found in Australia. AFDRS climate outlooks, out to 6 months ahead, are the first operational products of their kind in Australia and build on years of research and collaboration between the NSW Rural Fire Service, AFAC and the Bureau of Meteorology. The suite of products was designed through a user-centred process with operational applications in mind, using the Bureau's ACCESS-S seasonal model (the model).
Introduction
During the 2021–22 southern Australia fire season, we ran a trial to assess how the products performed to support agencies in their adoption of the new products. Through this trial, we provided interpretive support question-and-answer sessions and solicited feedback from land and fire management operations about how the outlooks reflected their observations (a formal verification process is yet to be established). Based on initial feedback, we made improvements and delved into the interpretive capabilities of the products. This paper outlines a significant technical improvement and one study into the product hindcasts, both of which lead to the effective operational use of the products.
Using curing climatology: technical improvement
Grasslands and savanna fuels cover most of the Australian continent. How dry the fuel is (curing) is an input into grassland and savanna AFDRS calculations (savanna intensity calculation is based on the grassland intensity with a wind reduction factor included). Matthews et al. (2019) determined the relative sensitivity of the rate of spread to perturbations in input variables. Rate of spread is used to calculate AFDRS intensity and has the same relative sensitivity. Curing sensitivity is significantly higher than sensitivity to other inputs.1 Thus, any improvement to the curing input values would lead to a significant improvement in the AFDRS intensity outlook.
Details on the analysis are in Matthews et al. (2019). For the purposes of this paper, the following interpretation suffices: a relative sensitivity value of x means that a 10% perturbation in the input curing causes a (10x)% change in the output.
The relative sensitivity values were averaged over ranges of values for ease of interpretation. Most notable is the relative sensitivity of 4.1 when curing is in the 40–60% range, very high sensitivity, which would occur most often in the shoulder seasons. Table 1 shows the grassland rate of spread based on vegetation curing.
Table 1: Grassland rate of spread sensitivity to curing.
| Curing level | 20-40% | 40-60% | 60-80% | 80-100% |
| Grassland mean relative sensitivity (st. dev.) | 2.9 (0.5) | 4.1 (0.12) | 2.9 (0.66) | 0.85 (0.37) |
Early in the trial, the ‘persistence’ method was used – where the current observed curing value is used for the outlook period, as is done for short-term forecasts. This is a suitable solution for the short-term as there is usually little change in the curing data in that period. However, the persistence method does not capture any changes to curing over longer periods. This is particularly important leading into the fire season. It was apparent during the 2021–22 southern fire season that this approach was insufficient.
Figure 1 shows national curing values. The blue ellipse highlights the fire weather areas of Upper Great Southern, Beaufort, Roe, Mortlock, Avon2 in the South West Land Division of Western Australia, which predominantly have grass fuels (on the fringe of forest fuel areas).
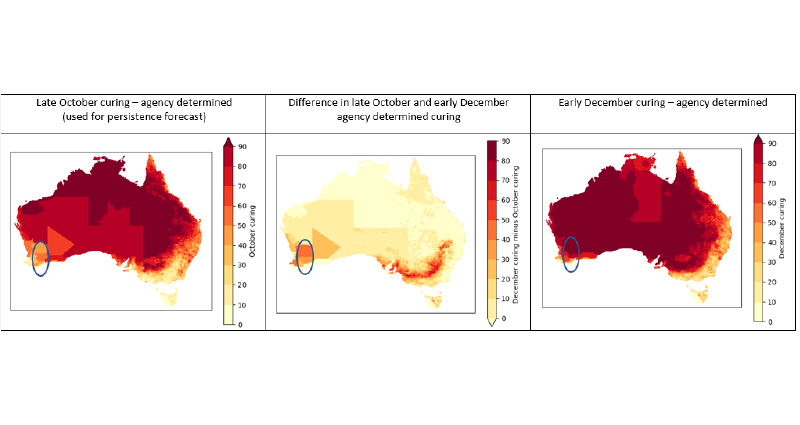
Figure 1: (Left to right) October curing – agency determined (used for persistence forecast), Difference in October and December curing, December curing – agency determined.
In October, the Roe and Beaufort districts had curing in the 40–60% range with relative sensitivity 4.1. The centre plot in Figure 1 shows that the late November curing was around double the 26 October curing. Figure 2 (left) shows the December outlook using the October curing (26 October 2022) shown in Figure 1 (left); Figure 2 (right) uses curing from 29 November 2022 shown in Figure 1 (right).
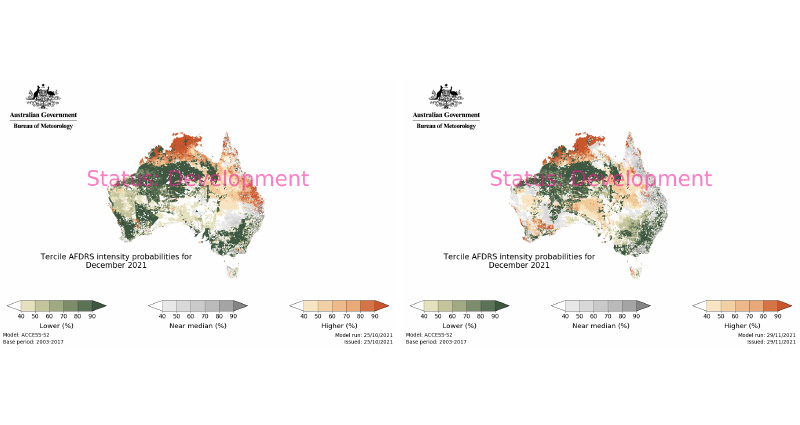
Figure 2: (Left to right) December forecast from 25 October 2021 (October curing), December forecast from 29 November 2021 (late November curing).
The forecast issued in late October showed a high chance of lower-than-average AFDRS intensity for December in the circled region. One month later, the outlook showed a chance of higher-than-average AFDRS intensity. The October curing resulted in a significantly lower estimation of the December averaged intensity than expected, given the atmospheric inputs. The devastating Wooroloo fire in southwest Western Australia started around 6 weeks after the October issued forecast.3 This had significant operational implications of underestimating the fire intensity and a possible lack of preparedness. Finding an appropriate value for curing was identified as an area for significant improvement.
A curing climatology was created from the BARRA dataset4, using the years of the AFDRS hindcast 2003–17. A daily climatology was created for each day from a 7-day window of values centered on the day.
The right image in figure 3 shows that the curing climatology for December is much closer to the agency determined December curing values (smaller difference) than the October agency determined values are (left image, larger difference).
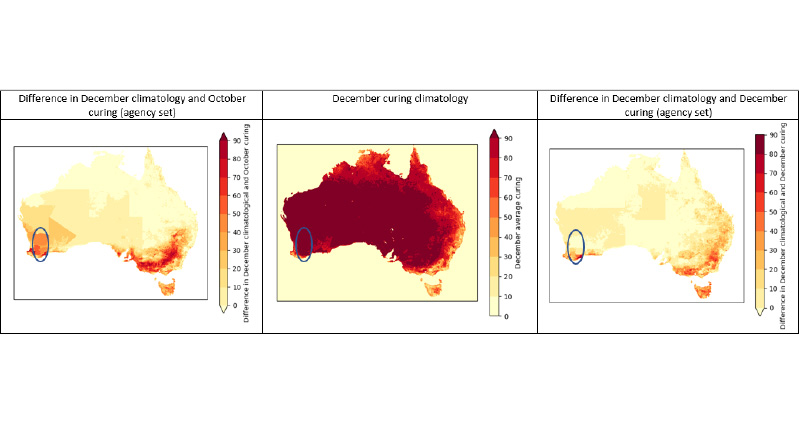
Figure 3: (Left to right) Difference in October curing and December climatology, December curing climatology using BARRA, Difference in December curing and December climatology.
Operational note
AFDRS outlooks are now calculated using the curing climatology. For operational interpretation, it is important to know how the actual curing compares to the climatology and take this into account:
- When curing is more advanced than the climatology, the outlooks will tend to underestimate the AFDRS intensity.
- When curing is behind the climatology, the outlooks will tend to overestimate the AFDRS intensity.
Further work is required to quantify how operational variations influence outlook probabilities. Users should exercise caution when curing differs to the climatology and conservatively interpret the conditions indicated by the outlooks.
Hindcast comparison: practical understanding
The outlook hindcast is generated using the model to produce a representation of the past from which we can calculate the average conditions. The chance of above median outlooks compare the model runs with the median of the hindcast to create a probability of the outlook period having above/below average AFDRS intensity (see Bureau of Meteorology 2022).
Users should examine numerous products for operational preparedness but must understand how the products may vary for the best interpretation. For this purpose, we compared elements of the AFDRS hindcast with the hindcast of other Bureau outlook products. We present the results for maximum temperature, which is one of the atmospheric inputs into AFDRS calculations.
Ideally, a hindcast would be calculated for a window of at least 30 years to capture the climate variability. The AFDRS outlooks are based on a relatively short hindcast period (2003-17) due to the limited availability of fuel information. The Bureau’s official outlook products have a hindcast period 1981–2018.
Climate variability in Australia is driven by climate change and large-scale climate drivers with irregular returns. The large 2 drivers are the El Niño - Southern Oscillation (ENSO) and the Indian Ocean Dipole, which have 2 non-neutral states; bringing either generally wetter and cooler conditions or warmer and drier conditions to Australia.
We compared the instances of each of the large-scale drivers captured by the hindcasts (see Table 2). The table shows the counts of El Niño and La Niña events, positive Indian Ocean Dipole and negative Indian Ocean Dipole, events and the count of the top 10 warmest years on record for Australia (nationally averaged).
Both hindcasts have a similar proportion of positive and negative Indian Ocean Dipole phases and El Niño events. The AFDRS hindcast period, however, has around double the proportion of La Niña events and 3 times the proportion of years in the top 10 warmest on record.
Table 2: Climate influences in hindcasts for the years 1981–2018 and 2003–2017.
| Climate driver | 1981-2018 (38 years) | 2003-2017 (15 years) | ||
| El Niño | 10 | 26% | 3.5 | 23% |
| La Niña | 8 | 13% | 4 | 27% |
| Negative IOD | 8 | 21% | 3 | 20% |
| Positive IOD | 7 | 18% | 3 | 20% |
| Top 10 warmest years |
8 | 13% | 6 | 40% |
La Niña events are generally associated with lower-than-average temperatures in the mid-latitudes and above-average rainfall in eastern, central and northern Australia (Bureau of Meteorology, 2022). The observed trends of climate change include increasing temperatures across Australia and decreasing rainfall across southern parts during April to October (Bureau of Meteorology and CSIRO 2020) as can be seen in figure 4. In broad terms, the influence of a La Niña could be seen to counteract the climate change trends (within a very short timeframe). We investigated if these opposing influences manifest as significant differences in the hindcasts, initially focusing on temperature.
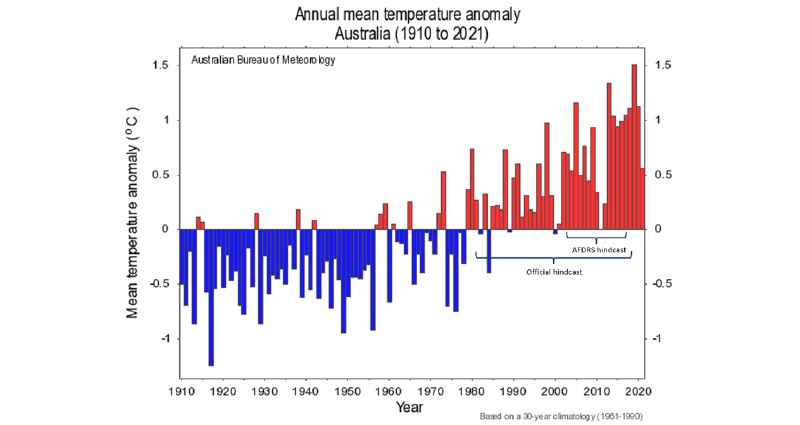
Figure 4: Temperature anomalies with AFDRS and official hindcast windows.5
We examined the average for each month with a lead time of one month (i.e. December average is taken from the 26 October hindcast). The differences are presented in Figure 5. There are variations throughout the year, but the average maximum temperature for the AFDRS hindcast window is generally either approximately equal to the longer hindcast average (white areas) or higher (blue areas).
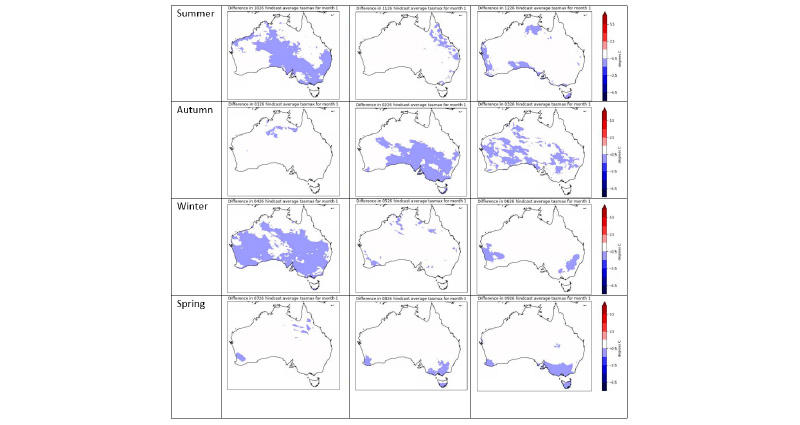
Figure 5: Differences of official hindcast and AFDRS period hindcast for average maximum temperature.
The average conditions of the AFDRS intensity hindcast are warmer than the average conditions, which are used to create the Bureau's maximum temperature outlooks for December, April and June but otherwise comparable. December and April are near the start and end of the mid-latitude fire season, respectively. June is around the start of the northern Australian fire season. When interpreting the various outlooks operationally, it is important to recognise that when the outlook is suggesting a high chance of above-average maximum temperature, the same atmospheric information might not necessarily translate to the expected above-average conditions for AFDRS, which has a higher benchmark for temperature.
This is consistent with the AFDRS hindcast being based on a shorter and more recent window and, thus, more representative of the current climate. The influence of climate change is, however, modulated by the higher proportion of La Niña events captured.
Operational note
Temperature is an input to the fuel moisture component of the AFDRS calculations for all fuels to a varying degree. This hindcast period difference would be particularly relevant during fire season shoulder seasons when temperature outlooks are expected to be slightly above the longer-term average and grass fuels are on track to be drier than the climatology would estimate. In that situation, the AFDRS outlook might not present as high a risk of above-average intensity as may be expected if the user were not aware of the nuances in the hindcasts. This could cause the user to incorrectly assess the risk of elevated intensity. This is an important operational consideration, particularly at the start and end of the fire seasons when conditions can be more changeable.
Summary
Climate outlooks can be very powerful planning tools, particularly leading into fire seasons. To gain the best intelligence from these outlooks, it is important for users to understand how variations in the inputs influence the information presented. This work highlights the importance of comparing the actual curing with the curing climatology for grass and savanna fuels as well as the differences between the hindcasts of the Bureau's temperature and AFDRS outlooks and when that difference may need to be considered.
Endnotes
1. Aside from relative sensitivity of dead fuel moisture content of -3.8 in the 15–20% range, refer to Matthews (2019) for details.
2. Western Australian Fire Forecast Areas Map at: www.bom.gov.au/wa/forecasts/firemap.shtml.
3. Dupe C & Dugan B 2021, Wooroloo bushfire: Emergency warning issued for fire in Beechina area. The Western Australian, 26 December 2021. At: https://thewest.com.au/news/bushfires/wooroloo-bushfire-emergency-warning-issued-for-fire-in-beechina-area-c-5092109.
4. Atmospheric high-resolution regional reanalysis for Australia, at www.bom.gov.au/research/projects/reanalysis/.
5. Climate change – trends and extremes.
References
Bureau of Meteorology 2022, About the climate outlooks. At: www.bom.gov.au/climate/ahead/about/#tabs=About-the-outlook.
Bureau of Meteorology and CSIRO 2020, State of the Climate 2020. Commonwealth of Australia. At: bom.gov.au/state-of-the-climate/documents/State-of-the-Climate-2020.pdf.
Bureau of Meteororlogy 2022, at: www.bom.gov.au/climate/enso/#tabs=Pacific-Ocean&pacific=About.
Matthews S, Hox-Hughes P, Grootemaat S, Hollis JJ, Kenny BJ, Sauvage S 2019, Australian Fire Danger Rating System: Research Prototype, NSW Rural Fire Service, Lidcombe, NSW. At: www.afac.com.au/docs/default-source/afdrs/afdrs_research_prototype_report_2019.pdf.