Abstract
This paper overviews our transition to digital data collection as an element of a systemic overhaul of Australian Red Cross emergency services monitoring and evaluation. We use the 2019–20 summer bushfires recovery program as a case study to demonstrate how the digital data transformation was implemented. The purpose of this change was to better measure and show outcomes and also to pay close attention to practitioner needs and utilisation of findings for program improvement, accountability to all stakeholders and knowledge generation.
Introduction
Monitoring and evaluation (M&E) in not-for-profit organisations is often hampered by resourcing issues including insufficient time and money, which can affect data accuracy and relevance (Bamberger et al. 2012). Limited utilisation of findings is a common result that is well established in the evaluation literature (Alkin & King 2017, Kelly 2021a, Snibbe 2006, Stufflebeam & Coryn, 2014). Despite this, the push for not-for-profit organisations to demonstrate their impact is accelerating (Kelly 2021b).
This paper overviews an aspect of our systemic M&E response in the domestic emergency services team at Australian Red Cross. Through this work, we sought to address calls for demonstrable impact while remaining sensitive to the need for utilisation. This paper outlines the data collection of our monitoring strategy, noting that monitoring is an integral element of effective programming that is regularly sidelined in favour of stronger focus on evaluation (Boardman 2019, Kelly & Reid 2021). Briefly, we define monitoring as:
...the tracking and checking of input, output, and outcome data that is continuously and methodically collected while evaluation refers to a judgment of the merit, worth, value and significance of a program or product. (Kelly, Goodall & Lombardi, p.1).
We have a small M&E function in emergency services at Red Cross based in Naarm/Melbourne on the unceded lands of the Kulin Nation. At the time of this digital data transformation, the M&E team consisted of 2 staff job-sharing one full-time position, situated in a wider team of nearly 250 personnel spread across the nation. We note this to highlight the level of resourcing we had available to develop the M&E system in emergency services. Having this internal function was invaluable at helping drive nationwide teamwork towards streamlined M&E systems and practices, as well as supporting development of evaluation literacy and capacity through consistent presence and stance (Rogers et al. 2019, 2021). The internal function enabled an holistic vision for M&E in the team, highlighting the importance of internal evaluation (Kelly & Rogers 2022, Laubli Loud & Mayne 2014, Sonnichsen 2000).
We have spent several years methodically and collaboratively working to connect the dots and create a system built on a foundational theory of change with relevant and meaningful data collected accurately and regularly to feed into evaluation and reporting. Stepping through the phases undertaken, this paper outlines how we transformed from haphazard and inconsistent collection of poorly considered piecemeal data, to a streamlined system of digital data collection where data were collected and utilised purposefully.
Background and building a solid foundation
During the bushfire season of 2019–20, devastating fires swept across eastern and southern Australia with massive and tragic consequences for communities. The extent and severity of the fires was unprecedented in Australian history (Davey & Sarre 2020). The Australian Red Cross plays a key role in emergencies, one of which is supporting communities to recover from disasters. Running across 4 states and 46 local government areas, the 2019–20 bushfire recovery program is the largest in Red Cross history. Due to the scale and urgency of this disaster, we needed real-time information about community needs and the organisation's ability to embed adaptive and timely responses to our recovery program across multiple regions. Working in so many areas and communities, with various local Red Cross teams, we needed to think differently about how we were going to collect this data.
To achieve this, the M&E team developed a framework and theory of change, articulating emergency services goals and outcomes for the program (Markiewicz & Patrick 2016). This was an evidence-informed and collaborative process between the national emergency services team and the state and territory teams, which drew from several pre-existing frameworks (e.g. Argyrous 2018, Commonwealth of Australia 2018, Inter-Agency Standing Committee 2017) as detailed elsewhere (see Kelly et al. 2022). Using an Agile management technique to enhance buy-in and relevancy (Beekharry 2017), we worked with personnel to develop measurable indicators for each of the program outcomes.
The next phase was for the recovery teams to develop logframes, based on the framework, for each state and territory. This allowed teams to articulate what they hoped to achieve and align those desires with overall program outcomes. They then mapped their field activities to the outcomes and indicators to ensure the data input was consistent, accurate and measurable.
Moving to digital data collection and analysis
The national emergency services team determined that digital data collection was essential due to the size of the recovery team as well as their wide geographical spread. A transition from collecting data in spreadsheets to live digital data collection would mean that teams could report directly in the field as well as allow the national team to have real-time data oversight and transparency. This was imperative for us to be successful with our recovery work.
To implement this digital transformation, the national team co-designed digital activity reporting forms with locally based personnel on a mobile data collection platform called Fulcrum. This collaboration was vital for supporting relevancy, ensuring ease of use in the field, and moving people away from thinking of reporting as a compliance exercise to a purposeful, useful, and empowering aspect of their work (Patton 2012, Rogers et al. 2021, Wadsworth 2011). Guidance documents, support and training for end users was key to our implementation and the success of this transition.
The national team now had recovery teams reporting real-time data from the field, but accessing the data necessitated that it was downloaded into spreadsheets. This was problematic and inefficient and made the streamlined ease of digital data collection redundant. The solution was dashboards, which automatically exported the quantitative data into graphs and tables that allowed us to visualise, in real-time, the data coming from the field. For the first trial of dashboards, we used the software program Tableau. This change in data collection and real-time reporting, through digital tools and visualisation, meant that data were received quickly and accurately, resulting in teams being able to use collated data for program planning and advocacy to address the needs of communities in a timely manner.
In addition to the quantitative data, important qualitative data that captured community voices were being collected via the Fulcrum app. Every day, field teams received feedback and information about the issues facing community members. This included what communities were feeling, their recovery needs, frustrations and stories of success and resilience. While field teams knew intimately the challenges and successes facing community members at a local level, what we heard from our stakeholders was that this information was not reaching decision-makers within and beyond the Red Cross. This highlighted the value of analysing and reporting key and emerging findings on a regular basis to provide stakeholders with evidence and insights for decision-making. Analysis of data is reported in monthly community sentiment reports, which are distributed to people working in recovery within and beyond Red Cross to support planning and coordination conversations and actions.
While these monthly reports are highly valued by stakeholders, compiling the reports was time consuming and resource intensive as the qualitative data submitted was often poorly entered and vast, with hundreds of entries per month. Making sense of the data required analysis skills to theme the data in the most meaningful manner. We used the recovery capitals (ReCap) as a framework for thematically analysing the qualitative data (Quinn et al. 2021). ReCap was developed by researchers at the University of Melbourne in collaboration with Red Cross, Bushfire and Natural Hazards Cooperative Research Centre, Massey University and others. The framework sets out 7 key recovery domains: social, built, human, political, natural, financial and cultural. This gave the analysis a logical structure and helped guide stakeholders to the information of greatest relevance to them and their programmatic mandate.
Data utilisation
Stakeholders from all levels of government, community members, service providers and emergency services policy makers highlighted the previous lack of information as a gap and expressed keen interest in the information collected by Red Cross field teams, noting its ability to provide details and evidence from the ground to inform recovery policy, planning and activity. Field staff noted that having detailed reports, which highlighted issues facing communities beyond their immediate locale, allowed them to understand concerns that could present at a future time and helped them advocate and put prevention measures in place to address those issues. This qualitative data collection allowed field teams to inform, advocate, and influence external considerations to promote community voice in recovery planning and ensure that community strengths and needs are included. By providing easy-to-understand and relevant evidence from the field in a timely manner, Red Cross field teams were able to support responsive recovery work that was tailored to community needs as they emerged. These reports allowed improved collaboration with local government workers as they were able to anticipate and plan for issues seen in other areas.
The dashboards that present the quantitative data and thematic reports allow teams to regularly monitor their work and assess whether and how things are tracking towards positive outcomes for communities. We use the information to inform internal and external reports and respond quickly to community needs. This method of evidence generation has been effective for executive buy-in and helped us influence the sector at the local, state and national levels.
The use of this information means our work is driven by evidence from the field, which supports learning, generates new knowledge, provides information for advocacy and contributes to overall program development and innovation. Throughout the process of developing a strong M&E system, we have maintained a focus on utilisation, recognising that without utilisation M&E is pointless (Kelly 2019, 2021; Patton 2012). In particular, keeping a focus on downward accountability to communities has been especially useful at helping us stay on track and create a system that contributes to and aligns with Red Cross organisational purpose and humanitarian principles.
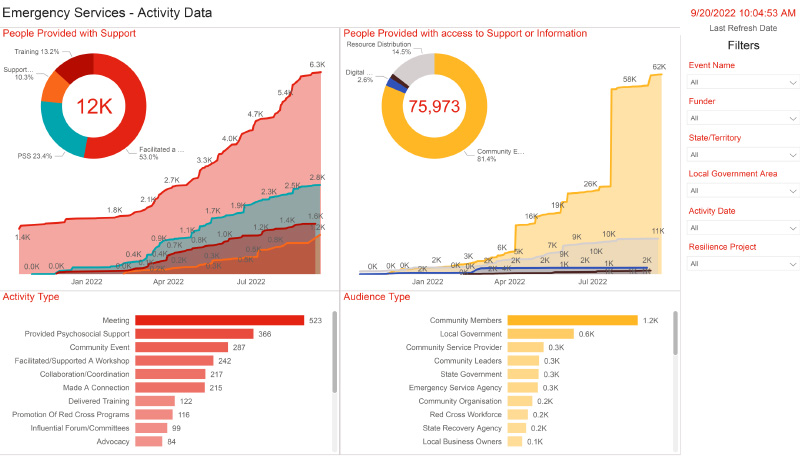
An example of how we quantify and demonstrate our work through graphs.
Source: Australian Red Cross
Implications and next steps
Using the lessons and techniques learnt throughout the 2019–20 bushfire recovery program, we went through a 6 month review process of our data collection tools and visual applications. This review considered the possibility of extending digital reporting across all emergency services within Red Cross. After a collaborative and informative review, the data collection tool was changed from Fulcrum to Kobo Toolbox and dashboards from Tableau to PowerBi. Both changes have been positive from an end-user perspective and in terms of accessibility across the program. In addition to displaying the quantitative data, through PowerBi we used Kobo Toolbox to collect our qualitative data and display the themes on dashboards. This meant teams have narrative available to them instantly and are not reliant on others to manually analyse the qualitative data before producing reports. We continue to produce the monthly community sentiment reports for personnel and external stakeholders to use for program planning and advocacy, but we have reduced the burden of analysis by 80% by streamlining the way data are collected and visualised.
Since January 2022, we have implemented digital reporting that provides visibility across the activities occurring in real-time. This includes response work for the 2022 floods in New South Wales and Queensland as well as our extensive community disaster resilience work across the country. Having high-quality monitoring data available has positive ramifications for improving our ability to support and advocate for communities. It enables us to share evidence of our contributions and community strengths and needs with our partners including other actors in the emergency management sector and government bodies. Additionally, the wealth of data available means we can evidence our value over time. This frees capacity for us to use evaluation consultants to examine narrow areas of interest rather than producing surface-skimming reports regarding basic program or project-level effectiveness. While we have come a long way, we continue to learn from this work, listen to our teams and community members, improve our systems and use data to track the stories of communities.
References
Alkin M & King J 2017, Definitions of evaluation use and misuse, evaluation influence, and factors affecting use. American Journal of Evaluation, vol. 38, no. 3, pp.434–450. doi:10.1177/1098214017717015
Argyrous G 2018, A Monitoring and Evaluation Framework for Disaster Recovery Programs, The Australia and New Zealand School of Government, Carlton. At: https://knowledge.aidr.org.au/media/5967/a-monitoring-and-evaluation-framework-for-disaster-recovery-programs-v2.pdf.
Bamberger M, Rugh J & Mabry L 2012, RealWorld Evaluation (2nd ed.), Sage Publications, Thousand Oaks, CA.
Beekharry M 2017, Applying agile project management methodology to natural disaster projects, Doctoral Thesis, University of South Australia, Adelaide.
Boardman M 2019, Exploring quality in the implementation of development projects: Insights from development NGOs, Doctoral Thesis, Deakin University, Burwood.
Commonwealth of Australia 2018, National Disaster Risk Reduction Framework, Commonwealth of Australia, Canberra. At: www.homeaffairs.gov.au/emergency/files/national-disaster-risk-reduction-framework.pdf.
Davey S & Sarre A 2020, Editorial: The 2019/20 Black Summer bushfires, Australian Forestry, vol. 83, no. 2, pp.47-51. doi:10.1080/00049158.2020.1769899
Inter-Agency Standing Committee 2017, A common monitoring and evaluation framework for mental health and psychosocial support in emergency settings, Geneva, Inter-Agency Standing Committee, Geneva.
Kelly L 2019, What’s the point? Program evaluation in small community development NGOs. Doctoral thesis, Deakin University, Burwood.
Kelly L 2021a, Evaluation in small development non-profits: Deadends, victories and alternative routes, Palgrave Macmillan, Cham, Switzerland. doi:10.1007/978-3-030-58979-0
Kelly L 2021b, Worthwhile or wasteful? Assessing the need for radical revision of evaluation in small-sized development NGOs. Development in Practice, vol. 32, no. 2, pp.201–211. doi:10.1080/09614524.2021.1937540
Kelly L, Goodall J & Lombardi L 2022, Developing a monitoring and evaluation framework in a humanitarian non-profit organisation using agile methodology, Disaster Prevention and Management. doi:10.1108/DPM-11-2021-0312
Kelly L & Reid C 2021, Baselines and monitoring: More than a means to measure the end, Evaluation Journal of Australasia, vol. 21, no. 1, pp.40–53. doi:10.1177/1035719X20977522
Kelly L & Rogers A 2022, Internal evaluation in non-profit organisations: Practitioner perspectives on theory, research, and practice, Routledge, New York. doi:10.4324/9781003183006
Laubli Loud M & Mayne J (Eds.) 2014, Enhancing evaluation use: Insights from internal evaluation units. Sage Publications, Thousand Oaks, CA.
Markiewicz A & Patrick I 2016, Developing monitoring and evaluation frameworks, Sage Publications, Thousand Oaks, CA.
Patton MQ 2012, Essentials of utilization-focused evaluation. Sage Publications, Thousand Oaks, CA.
Quinn P, Gibbs L, Blake D, Campbell E, Johnston D & Ireton G 2021, Guide to Post-Disaster Recovery Capitals (ReCap), Bushfire and Natural Hazards Cooperative Research Centre, Melbourne.
Rogers A, Kelly L & McCoy A 2019, Evaluation literacy: Perspectives of internal evaluators in non-government organizations. Canadian Journal of Program Evaluation, vol. 34, no. 1, pp.1–20. doi:10.3138/cjpe.42190
Rogers A, Kelly L & McCoy A 2021, Using social psychology to constructively involve colleagues in internal evaluation. American Journal of Evaluation, vol. 42, no. 4, pp.541–558. doi:10.1177/1098214020959465
Snibbe A 2006, Drowning in data. Stanford Social Innovation Review, Fall, vol. 1–9.
Sonnichsen R 2000, High impact internal evaluation: A practitioner’s guide to evaluation and consulting inside organisations. Sage Publications, Thousand Oaks, CA.
Stufflebeam D & Coryn C 2014, Evaluation theory, models, and applications (2nd ed.), Jossey-Bass, San Francisco.
Wadsworth Y 2011, Everyday evaluation on the run (3rd ed.), Allen & Unwin, Crows Nest, NSW.