Abstract
The number of people who live in bushfire-prone areas around the world is growing. In Australia, in the states of Victoria and New South Wales, over 1.5 million people live in areas rated as high to extreme bushfire risk in (SGS Economics and Planning 2019). As effects of climate change increase the size and severity of bushfires, and a greater number of people move into these at-risk areas, there is a growing imperative to understand the likely evacuation outcomes of bushfire-prone communities under various fire scenarios. This paper introduces a freely available simulation platform called WUI-NITY that can be used by evacuation planners and decision-makers to forecast evacuation behaviour within affected areas, and in turn, better prepare for and respond to future bushfire events.
Introduction
Understanding evacuation outcomes is crucial to develop pre-event community and evacuation plans, training programs and educational outreach materials as well as response-based evacuation and warning decisions that are safe and effective. The evacuation outcomes of most interest to planners and decision-makers include evacuation rates (or the percentage of people in an affected area that evacuate), the total clearance or evacuation time for the affected area, the location of congestion points and the numbers of people located in affected areas over time.
Evacuation simulation tools are used to plan for bushfire events. As technology becomes more sophisticated these tools may be viable for use in evacuation response and real-time decision-making. Simulation tools can be used to estimate how a population evacuates an area based on the community’s layout and features, varying population types and locations and current and future fire incidents. Simulation tools are the key to testing likely ‘what if’ fire and evacuation scenarios. This allows planners to test their plans or decisions under challenging conditions, for example delayed evacuation, limited road access or transport options and traffic congestion (Wahlqvist et al. 2021).
There are a number of evacuation-related simulation platforms currently available. Ronchi et al. (2019) reviewed fire, pedestrian and traffic models that can be used to estimate evacuation outcomes. These models were categorised in several ways, including by modelling approaches. Wolshon and Marchive (2007) describe 3 types of modelling approaches as simplified, refined and hybrid. Relating this to bushfire evacuation, the modelling approaches for bushfire spread (B), pedestrians (P) and traffic (T) within each category are as follows (Ronchi et al. 2019):
- in a simplified approach, models are empirical (B), flow-based (P), and macroscopic1 (T)
- in a refined approach, models are physics-based (B), agent-based (P), and microscopic (T)
- in a hybrid approach, models are a combination of these (e.g. mesoscopic [T]).
An additional way of categorising models is how they incorporate fire, traffic and pedestrian dynamics within the same platform. While some exceptions exist (Singh et al. 2021), most models simulate only one of the necessary features (i.e. fire, traffic or pedestrian) (Ronchi et al. 2017). Also, only a few of the available simulation platforms consider at least 2 modelling layers, for example (Beloglazov et al. 2016, Cova 2005). This paper introduces a freely available platform called WUI-NITY (Ronchi et al. 2019, 2020; Wahlqvist et al. 2021) that represents all 3 modelling layers of a bushfire evacuation, namely fire, pedestrian and traffic in a coupled manner that, together, forecast evacuation behaviour within an affected area over time.
WUI-NITY model overview
The WUI-NITY platform simulates and visualises human behaviour and bushfire development during evacuation of bushfire-prone communities. It was developed using a popular game engine (Unity 3D) so that fire spread, pedestrian response and movement, and traffic movement can be represented and visualised during bushfire evacuation scenarios (Intini et al. 2019). While the output is provided in 2D, the model has the potential to integrate a first-person 3D user-experience that could be used for visualisation purposes as well as future virtual reality interaction with the evacuation scenario space (Wahlqvist et al. 2021).
The WU-NITY platform is modular in that it allows for the coupling of different submodels to estimate evacuation performance. While the current submodels for each domain (i.e. fire, pedestrian and traffic) are simplified in their approach, these submodels can be replaced at any time with more sophisticated (e.g. refined approach) models in the future. The current models (i.e. empirical, macroscopic) were selected since they require only limited computational resources that can allow for their use in planning and real-time decision-making applications.
How WUI-NITY works
The functionalities of the WUI-NITY platform are described using a generic timeline for a bushfire event. A simulation begins with the ignition of a fire and its spread throughout a particular region. Before a warning is given, the model simulates ‘background traffic’ via a vehicle density modifier to account for vehicles initially on the road network (at the start of the fire). Background traffic can include vehicles driving into or through the affected area for trips unrelated to evacuation, as well as some percentage of the affected population who decides to evacuate before any warning2 is given.
Once a warning is given to particular areas or locations affected by fire, the model simulates a given percentage of people who decide to evacuate. These evacuees may decide to leave their household and enter the road network right away or delay for some period of time before doing so. At the same time, the model accounts for some proportion of the population located outside of the warning areas who also decide to evacuate, referred to as ‘shadow evacuees’. WUI-NITY also accounts for the percentage of individuals who decide not to evacuate.
During the evacuation, the model incorporates likely events that can influence evacuee travel times, including routes and destinations being blocked or rendered unavailable due to the fire, shelters reaching capacity or closing, car accidents and road lane reversals. Once the evacuation from the affected area is completed and all evacuees have reached their destinations, the clearance time for the affected area and the evacuation (arrival) time curves at each destination are estimated. Other WUI-NITY outputs include (at each time-step):
- the traffic flow at final destinations (i.e. the number of vehicles arriving at the final destinations over time)
- the number of vehicles in different parts of the road network
- the number of vehicles that have not yet reached a destination
- the number of remaining residents, evacuees and those located in refuge
- the density values (visually) for each road section.
WUI-NITY submodels
A brief discussion is provided on each submodel based on Ronchi et al. (2020) and Wahlqvist et al. (2021) that provide additional information on the specifics of the fire, pedestrian or traffic models.
The user has 2 choices for simulating the fire scenario(s). Users can import simulation results from the FARSITE model3, or they can use a custom cellular automata implementation of the BEHAVE fire model4 that was recently incorporated into WU-NITY (Ronchi et al. 2021). The outputs of the fire model serve as important inputs to the other WUI-NITY submodels and include the time of arrival, fireline intensity, flame length, rate of spread and fire spread direction.
The pedestrian submodel distributes the population throughout the affected area and simulates pedestrian/household response and movement into traffic networks. To distribute the population, data from the Gridded Population of the World5 are imported into WUI-NITY, from which population counts and density are provided with a resolution of 1 km2 area. WUI-NITY proportionally redistributes the simulated population based on the proximity of the 1 km2 cells containing the population data to the road network. By doing so, WUI-NITY puts simulated residents in likely residential areas that have access to roads (rather than being placed within national parks, for example). From there, households are generated randomly (assigning 1–5 people per home by default) however, users can override this default. Response delays are assigned to households via a log-normal (or custom) distribution to account for the fact that most people do not evacuate right away. Instead, people are more likely to perform a series of activities before and after they decide whether to evacuate (Kuligowski 2021, Strahan & Gilbert 2021). Evacuation rates, or the probability of evacuation, is assigned throughout the population via response delays.
Within the pedestrian submodel, WUI-NITY simulates the movement of individuals from their household to the nearest traffic node to represent the movement of individuals to their vehicles. Movement speeds are assigned to residents through a default uniform distribution ranging from 0.7 to 1.0 m/s however, a multiplier (greater than 1) can be adopted to represent local movement inefficiencies or people who require adoption of slower speeds. The output from this pedestrian model (the number of people entering the traffic network over time in a cell or traffic node) becomes the input to the traffic model.
For the traffic submodel, WUI-NITY incorporates data from OpenStreetMap6 (OSM), a freely available worldwide database to develop the road network.7 WUI-NITY incorporates satellite images to enhance visualisation. The inputs for this submodel include the percentage of vehicle density (i.e. background traffic) and the arrival of occupied vehicles into the road network (obtained from the pedestrian submodel). Traffic movement is represented at the macroscopic level, considering the conservation law of vehicles (i.e. speed-density relationship). Traffic flows are simulated through a speed-flow-density relationship, where the Lighthill-Whitham-Richards model is applied to calculate the actual impeded speed of each car (Wahlqvist et al. 2021). Since the model is macroscopic, overtaking is not explicitly represented and the intersections are assumed to be without signals inhibiting flow.
The evacuation destinations in WUI-NTY are user-defined either via point-click in the GUI or via a list resembling an Origin-Destination matrix. Routing choice, which can be the shortest, fastest or user-defined, is computed via an open-source route planning tool (Itinero). This is used to allow for dynamic changes in the scenario to be captured, for example, loss of routes due to the fire spread.
Additional features of the WUI-NITY platform
The WUI-NITY platform is coupled with a trigger buffer tool called the Population Evacuation Trigger Algorithm (PERIL) (Mitchell & Rein 2020). PERIL allows for the identification of trigger buffers around a community based on bushfire- and population-based inputs from WUI-NITY.
A trigger buffer, while not a new concept (e.g. Cova 2005) is a geographical perimeter around a populated area exposed to a bushfire. These perimeters are useful in evacuation decision-making since they are meant to assist in decisions about when an evacuation warning should be issued for bushfire-affected areas. These buffers represent the boundary whereby, once crossed by a fire, indicate the need to prompt evacuation of that community to ensure sufficient time for the community to leave before the fire spreads to the community’s edge.
Figure 1 shows an example diagram of timescales for fire spread and egress in a bushfire-prone area, adapted from Figure 7 in Li, Cova and Dennison (2019) and previously published in Wahlqvist et al. (2021). In this figure, the dotted line describes the trigger perimeter designated around the affected community and the orange perimeters (solid lines) indicate the fire front at specific time increments approaching the community. The timescale shown begins with the point of fire detection until the fire intersects the populated area. In this example, the community is successfully evacuated before the wildfire reaches the community (i.e. WASET is greater than WRSET).8 When the bushfire is confirmed as arriving (i.e. trigger buffer time) the decision to trigger the evacuation is taken and the community begins moving to safety (i.e. the evacuation time starts (WRSET)).
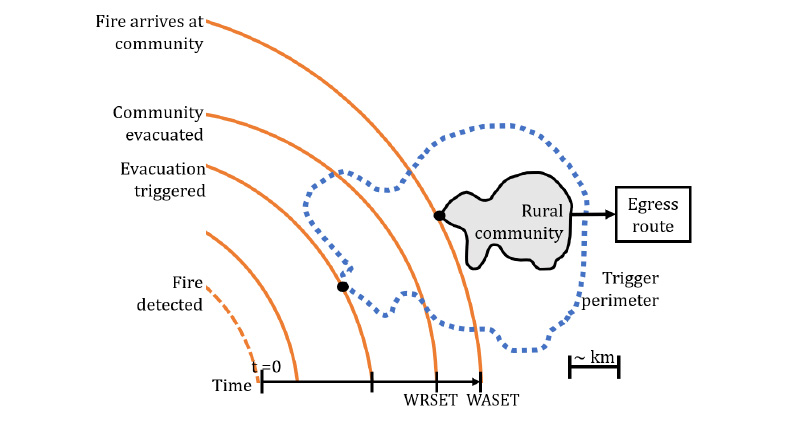
Figure 1: An example diagram of the timescales for fire spread and egress in a bushfire-prone area.
The objective is that the community is evacuated well before the bushfire reaches its edge (i.e. WASET is much greater than WRSET plus a safety factor [SF]). The location of the trigger buffer perimeter is critical since it allows a window of time in excess of what is required (i.e. safety factor is greater than 1).
PERIL has been developed to calculate these geographical perimeters around particular bushfire-prone communities based on the fire spread (via topological configuration of the terrain, type of land, weather and wind) and the clearance time estimates from WUI-NITY. During the planning process, several trigger buffers can be developed for a particular community based on simulation results from a number of likely fire and evacuation scenarios.
Another feature of WUI-NITY is the capability of performing dynamic vulnerability mapping. Outputs from the pedestrian and traffic submodels are used (i.e. the number of people remaining in the affected area over time either at home or on the road). Results can be presented in terms of a ratio or a dose.
These types of vulnerability assessments can identify via a colour-coded map, the capacity of a population to cope with the fire situation and the effectiveness of any evacuation procedure being simulated (Wahlqvist et al. 2021).
Discussion and conclusions
The WUI-NITY platform was developed to produce needed insights into evacuation performance, enabling planners and decision-makers to identify vulnerable locations and populations in specific fire and evacuation scenarios. Using a consistent level of granularity, the platform is unique in its coupling of fire, pedestrian and traffic movement to estimate evacuation outputs as well as to generate trigger buffers and vulnerability estimates.
Recent work has validated the model and demonstrates its use and benefits. WUI-NITY was validated using data collected from an evacuation drill in a community in Colorado, US (Ronchi et al. 2017) as well as against traffic speed and flow data obtained from the California Department of Transportation Performance Measurement System database during the 2019 Kincade fire in Sonoma County, California.
As with any model, WUI-NITY makes assumptions about features within the scenarios, including the population. These assumptions are that all residents are at home at the time of the fire, the household is together, and they leave together when evacuation begins and only private vehicles are simulated. Additionally, WUI-NITY does not currently account for pedestrian evacuation on foot. In the future, additional features are planned (e.g. evacuation on foot and/or via sea, smoke modelling).
Endnotes
1. Macroscopic models represent traffic behaviour at the aggregate level to identify broader trends in evacuation behaviour, while microscopic models allow for the simulation of individual vehicles. Mesoscopic models are a combination of these 2 methods, for example, describing vehicles at a higher level and their interactions at a lower level of detail (Intini et al. 2019, Kuligowski 2021).
2. The term ‘warning’ refers to advice, watch and act or warning messages.
3. Further information on FARSITE is at www.firelab.org/project/farsite/.
4. Further information on Behave is at www.firelab.org/project/behaveplus.
5. Gridded Population of the World v4 at https://sedac.ciesin.columbia.edu/data/collection/gpw-v4.
6. https://www.openstreetmap.org
7. The road network data can be customised by the user by directly modifying the source OSM dataset.
8. WASET refers to the available safe egress time in the wildland-urban interface (or bushfire-prone) area and WRSET refers to the required safe egress time in the wildland-urban interface (or bushfire-prone) area. These concepts were first introduced in (Ronchi et al. 2017).