After heavy rainfall or large flood events, newspaper headlines tend to use dramatic language and are too brief to tell the whole story. What does it all mean? How big are these events and how often are they likely to occur? Is there a more accurate way of communicating probability?
Engineers Australia led a review of the Australian Rainfall and Runoff guidelines and recommended some changes in terminology used for probability. The Bureau of Meteorology is adopting this terminology to describe the probability of heavy rainfall for forecasts and observations.
What is changing
The updated terminology uses Annual Exceedance Probability (AEP) displayed as a percentage. It emphasises that there is an equal probability of an event of a specified size occurring or being exceeded in any given year.
Previous terminology using Average Recurrence Interval (ARI), such as in ‘1-in-100-year event’, is now discouraged as it suggests an elapsed time between each event. For example, after hearing that a location had experienced a 1-in-100-year event, you might be forgiven for thinking, ‘I won’t live to see another one of those in my lifetime’. However, statistics show there is a 26 per cent chance that a 1-in-100-year event could occur during a 30-year timeframe.
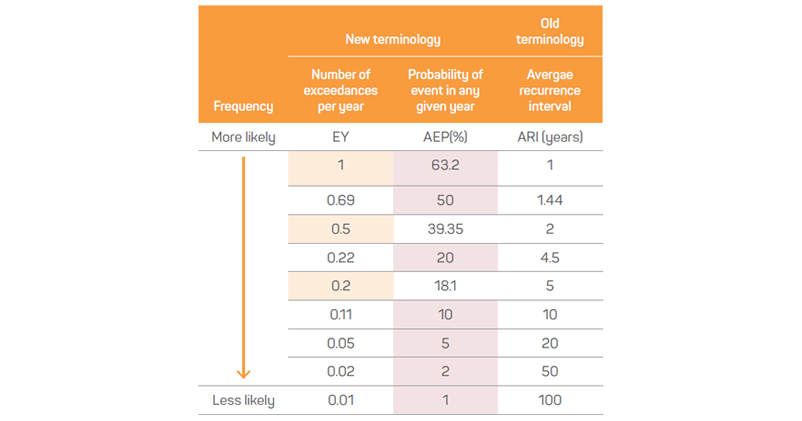
The table shows how the new terminology relates to the old. The shading represents the preferred new terminology for particular probabilities.
What it means
One way to describe this is that a 1-in-100-year event has a 1 per cent chance of happening in any given year, while a 1-in-1-year event has a 63.2 per cent chance of happening in any given year. For rainfall and flooding, these values are usually based on observations and therefore related to the climate of the region.
The probability of a specific rainfall amount or flood height occurring in a given year is not dependent on what has happened in recent years. It is possible for an event to occur more than once and such events can be clustered. It does not matter if there was a 1-in-100-year event two years ago, the chance of it occurring in the current year is still 1 per cent.
How to use the new terminology
The rainfall for a storm can be compared with the design rainfall estimates to determine the probability of the event. Flood flows can be compared with a flood frequency analysis.
Annual Exceedance Probability will be generally used for rainfall events with a probability of 50 per cent AEP and less.
The correct way to use the new terminology is to refer to the probability range that event falls within and the relevant storm duration.
The recent rainfall event had an annual exceedance probability of between 5 per cent and 10 per cent for the 3- to 12-hour durations.
There was 26.6 mm in an hour during an afternoon storm yesterday. The probability of this occurring in any given year is between 2 and 1 per cent AEP.
For other audiences, these statements can be simplified to the more frequent probability:
The recent rainfall event had less than a 10 per cent chance of occurring for durations shorter than 24 hours.
The 26.6 mm of rain in an hour during an afternoon storm event has less than a 2 per cent chance of happening in any given year.
So perhaps, future newspaper headlines will tell us what we actually need to know.
Terminology and definitions
Annual Exceedance Probability (AEP) – the probability of an event being equalled or exceeded in any given year, usually expressed as a percentage.
Average Recurrence Interval (ARI) – the average time period between occurrences equalling or exceeding a given value.
Exceedances per Year (EY) – number of times that an event is likely to occur or be exceeded within a year.
Intensity-Frequency-Duration (IFD) – These are statistical rainfall values used in the design of infrastructure in Australia, also known as Design Rainfall estimates. These design rainfall values are the amount of rain falling over different storm durations compared to historical records in the local area to determine the probability.
Probability – The chance of an event occurring based on statistical analysis of historical records, usually expressed as a percentage.