Natural hazards cause sustained loss to the environment, yet the economic costs are largely not accounted for due to a lack of market measures. This research applies methods of global and national costing and proposes an integrated framework that incorporates marketable and non-marketable losses including those to the environment. These methods are applied to bushfires in the Northern Territory for estimating the cost of loss of ecosystem services as a surrogate. These fire events affect 20 per cent of the total land area annually (based on 18 years average from 2000–2018) and cost ~$150 million per annum. Losses were greatest on the Indigenous lands, followed by pastoral and conservation areas. It is calculated that the effect of bushfires on ‘loss of wellbeing’ for the remote Indigenous population is, conservatively, $272 million per year. An understanding of the costs of loss of environment is essential to develop emergency management policies that are effective in enhancing the resilience of communities.
Based on a paper presented at AFAC19 – the annual conference of AFAC and the Bushfire and Natural Hazards CRC.
Introduction
Disasters that arise from natural hazards present serious concerns, not only for people, but also to the natural environment. This is due to the significant increase in their frequency, intensity and impact on global populations over the past 50 years (World Risk Report 2017, Centre for Research on the Epidemiology of Disasters [CRED] and United Nations Office for Disaster Risk Reduction [UNISDR] 2018).
Australia is highly exposed to extreme natural hazards particularly cyclones, floods and bushfires (Guha-Sapir, Santos & Borde 2013, UN and ECLAC 2014). Approximately 80 per cent of Australia’s population reside in coastal areas and much of this area is directly exposed to cyclones and floods with inland areas experiencing a history of severe bushfires (Ladds et al. 2017, Sangha, Edwards & Russell-Smith 2019a). On average, the total cost of disaster-related losses is estimated at $1.75– $3.26 billion per annum in 2013 values as detailed by Ladds and colleagues (2017) or $18.2 billion per annum in 2016 values as detailed by the Australian Business Roundtable for Disaster Resilience and Safer Communities (ABRDR&SC 2017). Most of these costs account for marketable losses of direct and indirect goods and services but exclude the loss of environmental assets and their benefits to people.
Measuring a true cost of these disasters, particularly including loss of environmental assets and their benefits, remains a challenge. In a recent report, CRED and UNISDR (2018) highlighted that the reported losses account for part of the story and 63 per cent of the disaster-related reports to the EM-DAT (the international Emergency Management Database managed by CRED) contain very little accounting for environment losses, if any. That report stressed the need to evaluate environmental costs.
Current methods for measuring loss from disasters largely rely on insurance data (e.g. insurance losses of infrastructure or crop and livestock production) with very little account of environmental assets and their benefits (Handmer, Ladds & Magee 2018). To fully understand the cost of disasters, accounting measures need updating to include people’s wellbeing and the related losses that are outside the typical market economy.
Determining bushfire-related environmental loss is critical to understanding the total economic costs and to plan for disaster management and resilience policies. In Australia, the northern landscape is imbued with Indigenous cultural and spiritual values (Archer et al. 2019). When bushfires destroy these values, current techniques (applied by emergency service organisations) typically fail to consider or document their loss because there is no loss of infrastructure. Understanding community values concerning the natural environment and incorporating them into policy-decision-making is a first step. Hence, developing appropriate accounting techniques to estimate disaster-related losses from a wellbeing perspective is essential.
This paper offers an integrated framework to account for environmental—largely non-marketable (and other tangible or marketable)—losses. Various cost-valuation techniques from the trans-disciplinary field of ‘Ecological Economics’ are also applied. Environmental benefits such as clean air or regulation of water supply and their losses are considered as non-marketable because these are not traded in the typical market. A costing framework is presented to underpin these losses. A case study is used to cost bushfires-related losses for the Northern Territory (NT). The NT experiences bushfires that are expansive and frequent, yet no costs are estimated as losses from these bushfires are mainly non-marketable. Such losses are assessed in terms of loss of wellbeing for remote Indigenous populations. Incorporating the loss of environmental values and wellbeing could help evaluate total disaster-related losses to inform disaster management policies and enhance resilience.
Economic costing frameworks
The key global frameworks used to assess the losses attributed to disaster events include the United Nations Economic Commission for Latin America and the Caribbean (UN ECLAC) (2014) and the World Bank (2010).
The UN ECLAC (2014) framework includes three domains:
- Direct damages (stocks) and losses (flows) (marketable and tangible): these are physical and include public infrastructure; public, business and private buildings; crops and farmland.
- Indirect losses (occurring as a consequence of the disaster) (marketable and tangible): relate to business disruption and loss of public services including transportation, health and education.
- Non-marketable losses (non-marketable and intangible): relate to social (fatalities, injuries), psychological (health impacts) and environmental losses.
Direct damage assessment is measured from insurance losses, which are used to calculate total damage applying factors or ‘multipliers’ (simple factors for particular types of disasters). The ECLAC approach is to estimate the cost of repairing or replacing damaged infrastructure as well as the effects on various social and economic sectors, such as education, health and balance of payments. However, the loss of environmental services to wellbeing is not estimated yet well acknowledged (UN ECLAC 2014).
In Australia, a similar framework is followed, as reported in the assessments conducted by Handmer, Ladds and Magee (2018), ABRDR&SC (2017), Bureau of Transport Economics (2001) and others. Direct losses are estimated using insurance data, and indirect losses (e.g. loss of public or private service) from other sources of data and or applying the factors of Insurance Loss Ratio (Joy 1991) or multipliers for death and injury. For example, the Insurance Loss Ratio for bushfires and storms is 35 per cent; meaning the insurance losses from bushfires and storms represents 35 per cent of the total losses. Similarly, the Insurance Loss Ratio for tropical cyclone, floods and earthquake represent 20 per cent, 10 per cent and 25 per cent, respectively, of the total costs. In other words, a factor of 3 for bushfires and storms, 5 for cyclones, 10 for floods and 4 for earthquake is typically used to calculate the total costs. In Australia, the Insurance Loss Ratio is equivalent despite significant variations in how people value resources in different parts of the country.
Direct damages and indirect losses are considered tangible or marketable while social, psychological and environmental losses are considered intangible or non-marketable. The UN ECLAC (2014) and Australian frameworks amalgamate direct and indirect intangible losses under intangible. In contrast, the World Bank (2010) framework measures the economic losses from disasters for direct and indirect costs, each involving marketable and non-marketable losses:
Direct costs:
- Marketable: public infrastructure; public, private and business buildings; crops, livestock and fences.
- Non-marketable: health, death, loss of ecosystems and their services, and cultural assets.
Indirect costs (as a consequence of disaster):
- Marketable: business disruption, communication and network and computer disruption, loss of work and public services, residential and non-residential clean-up.
- Non-marketable: poor health; loss of public amenity; loss of water, electricity and gas services; sewerage treatment and volunteer services.
Table 1 shows the application of the World Bank (2010) framework, with some modifications, for distinguishing marketable and non-marketable losses within direct and indirect categories to consider how each loss impacts on people’s wellbeing.
Overall, total disaster costs = Direct (marketable ($) + non-marketable losses ($ and non-$ measures)) + Indirect (marketable ($) + non-marketable ($ and non-$ measures)) losses.
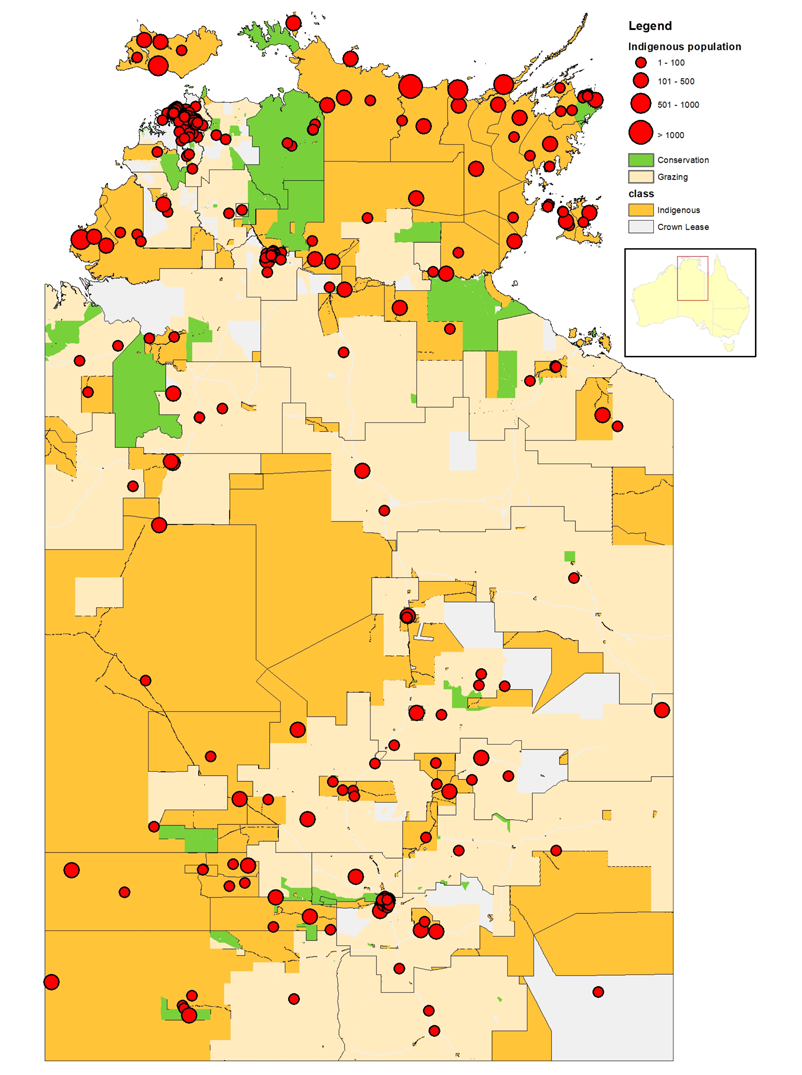
Figure 1: Indigenous communities and dominant land uses in the Northern Territory.
Source: ABS 2016, CAPAD 2016 and Aboriginal land entitlements under ALRA (1976).
Case study: costing bushfires in the NT
Bushfires are an ecological driver of the mesic savannas and arid lands of central and northern Australia and fire management has been practised by Indigenous people for millennia (Russell-Smith et al. 2003). Traditional fire management involved burning the land for various reasons as people moved around (Yibarbuk et al. 2001). These fires were set incrementally throughout the seasons particularly during lighter winds and in moist or uncured fuels. They were generally small (<1 km2) and patchy and were more or less even across the landscape (Garde et al. 2009). This practice of burning led to:
- breaking up of continuous ground layer fuel loads, thus restricting the spread of unintended fire
- a mosaic of different seral stages of post-fire vegetative regeneration, providing a variety of food and habitat and enabling the persistence of fire-sensitive biota (Letnic et al. 2004).
These practices have largely ceased with the collapse of Indigenous populations (Burrows, Burbidge & Fuller 2006). As a result, contemporary unmanaged fire regimes have become dominant with extensive severe bushfires occurring during hot and dry windy weather (Russell-Smith et al. 2013). However, traditional fire practices are being revived, particularly in the north of the Territory.
The NT population is approximately 246,000 with 27 per cent being Indigenous. More than 50 per cent of Indigenous people live in remote areas (35,414 people) (ABS 2016) and are spread across the NT landscape (Figure 1), some retaining knowledge and skills to manage fire (Russell-Smith et al. 2013).
Although the current Emissions Reduction Fund scheme offers opportunities to manage fires, these are limited to areas above 600 mm rainfall isohyet in northern Australia, covering an area of 1.2 million km2. However, the frequency of bushfires, particularly late dry-season fires, and the damage they cause to biodiversity and water resources as well as to Indigenous cultural and sacred sites, is enormous (Figure 2) (Russell-Smith et al. 2013, Letnic et al. 2004). So far, there has been no accounting of bushfire-related losses in the NT, which are assessed here.
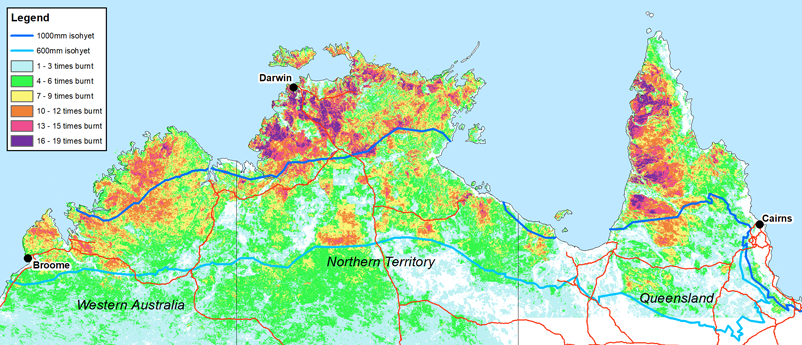
Figure 2: Average fire frequency 2000–2018 across northern Australia with 600 mm rainfall and 1000 mm rainfall isohyet regions.
Source: North Australia and Rangeland Fire Information website (www.firenorth.org.au/nafi3/)
Methodology
Burnt area estimations
In order to quantify the effects of bushfires, fires greater than 1 km2 were considered as having a negative effect. This threshold has been applied in assessment of fire regime change with regard to addressing the needs of fire-vulnerable fauna and flora with restricted home ranges and dispersal capacity in northern savannas (Evans & Russell-Smith 2019). It is also commensurate with the mean size (63.9 ha) of traditional fires documented from historical aerial photography in an arid setting (Burrows, Burbidge & Fuller 2006). A fire history archive from North Australia Fire Information1 covering the NT between 2000 and 2018 was used to create layers of individual fires as defined by mapped events attributed with unique dates. These fires were classified into four size classes (0>1 km2, 1–10 km2, 10–100 km2 and >100 km2).
Bushfire cost estimation
Bushfires are a threat to the NT and also across northern Australia. The loss of ecosystem services (defined as the benefits humans derive from their ecosystems (Millennium Ecosystem Assessment 2003)) from the fire-affected landscape was estimated using the burnt area extent and applying three scenarios to each of the three fire-size classes (excluding less than 1 km2 fires).
A step-wise approach included:
- Estimating the fire frequency from 2000–2018 for bushfires varying in size from >1 km2, 10 km2 and >100 km2 area. This means that fires >1 km2 also include fires of sizes >10 km2 and >100 km2, similarly fires >10 km2 size include >100 km2 size fires but exclude fires of size <10 km2.
- Categorising the burnt area under three main land tenures of Indigenous, conservation and pastoral, using data from the National Native Title Tribunal, Aboriginal Land Rights Act (Northern Territory) 1976 for Indigenous, Collaborative Australian Protected Areas Database (CAPAD 2016) for conservation, and NT cadastre dataset for pastoral land use.
- Dividing the NT into low (less than 600 mm) and high (greater than 600 mm) rainfall regions as the Emissions Reduction Fund scheme is applicable only to the latter and not the former.
- Estimating the costs for loss of ecosystem services from the burnt area for each land-use category, following the rationale that healthy ecosystems deliver ecosystem services that contribute to human wellbeing (Millennium Ecosystem Assessment 2003, 2005; de Groot et al. 2012; Costanza et al. 2014).
To estimate the value of loss of ecosystem services from bushfire-affected landscapes, the cost of managing those ecosystem services was assessed (following de Groot et al. 2012 and Millennium Ecosystem Assessment 2003) for each of the selected land uses (Indigenous, conservation and pastoral). Following a study by Sangha and colleagues (2017), the cost of managing the flow of ecosystem services was estimated at $780 per km2 (in 2018 value) that was used for the total burnt area. For conservation, the loss of ecosystem services was assessed applying a value of $865 per km2 derived from the cost of managing national parks across northern Australia (Sangha, Edwards & Russell-Smith 2019b). For pastoral lands, loss of pasture production was considered applying a conservative value of $264 per km2 for gross income from a large north Australian dataset (Russell-Smith & Sangha 2018) using pasture, cattle production and financial income data from Australian Bureau of Agriculture Resource Economics and Sciences (ABARES) (2017) and others.
Specific Indigenous bushfire costs
Bushfire costs for Indigenous lands were assessed applying a substitute value of welfare expenditure that the Australian Government spends on Indigenous people in the NT (Sangha et al. 2017). The Steering Committee for the Review of Government Service Provision (2017) reports on Indigenous expenditure for six main welfare sectors, each with 3–4 sub-sectors. Of those, only three relevant welfare sectors were selected:
- developing safe and supportive environments
- healthy lives with a sub-sector on public and community services
- enhancing economic participation.
The average total welfare expenditure for an Indigenous person in the NT is $68,186 per annum (2015–16 value), but that amount for the selected sectors and sub-sectors was estimated at $30,695 per person per year (in 2018 values).
The rationale for this approach is that Indigenous people derive substantial wellbeing benefits from being connected to country (i.e. traditional land) and the selected welfare sectors of economic, health and safe and supportive environment services directly relate to country. It is assumed that bushfires affect the wellbeing of Indigenous people by compromising their economic opportunity, health and safe and supportive environments (Sangha, Gerritsen & Russell-Smith 2019).
The cost of bushfires in the NT was estimated only for the remote Indigenous population of 35,414 applying a substitute value of 25 per cent of welfare expenditure on three sectors and subsectors, thus, $7,673 per person per year from a welfare cost of $30,695 per person per year (following a conservative scenario of 25 per cent used in Sangha, Gerritsen & Russell-Smith 2019). In doing so, our approach remains conservative for considering only 25 per cent of loss of benefits for three welfare sectors as Indigenous people, particularly in remote locations, obtain multiple benefits by being connected to country (Burgess et al. 2009, Social Ventures Australia 2016). Details of this methodology are published by Sangha and colleagues (2017) and Sangha, Gerritsen and Russell-Smith (2019). All values are reported in AUD (in 2018) except stated otherwise.
Table 1: Framework to measure the effects of disasters on people’s wellbeing for various direct and indirect losses.
| Natural disaster impacts on human wellbeing | Economic indicator | Details and sources |
| Direct marketable losses: private, business and public buildings, infrastructure, farmland, etc. |
Insurance costs or loss of production using market value. |
BTE (2001), Handmer, Ladds and Magee (2018) and Ladds and colleagues (2017). Example: In Australia, loss of pastoral production is estimated for dry pastures at $30/ha, irrigated $370/ha and fences 5000/km2 (BTE 2001). |
| Direct non-marketable losses: health injury and/or death |
Loss of work opportunity over a person life span estimated by applying ‘Value of a Statistical Life’ concept. Alternatively, because human live is priceless, listing the number of deaths is an adequate indicator itself to inform the policies. |
Handmer, Ladds and Magee (2018) Example: $4.2m is applied for loss of a statistical life, $853,000 for serious and $29,600 for minor injuries (Office of Best Practice Regulation 2014). The number of deaths can be listed without applying any monetary measure, following CRED and UNISDR (2018), World Disasters Report (2018) and World Risk Report (2017). Serious and minor injuries could be costed (as above) as individuals may have a chance to resume normal life after the recovery process. |
| Loss of ecosystems and their services: loss of clean air or water, aesthetic value of the landscape, or the production potential of farming lands |
Affected area of all ecosystems, and related loss of ecosystem services that are important for people’s wellbeing. It involves evaluating how people value their natural systems and applying marketable and non-marketable tools. |
Loss of ecosystem services can be estimated using:
Example: Loss of wetlands in the United States of America due to hurricanes estimated at US$33,000/ha (2007 values) (Costanza et al. 2008). |
| Loss of cultural assets |
Insurance losses or reconstruction costs for man-made structures. If an asset is part of a natural landscape, then measuring the monetary and non-monetary loss of the asset’s service. Numbers of visitors and related travel losses can also reflect the value of lost asset. |
Replacement methods or reconstruction costs can indicate the loss of natural and cultural assets. For loss of nature-related cultural sites, cost of managing natural and cultural lands or the value of lost services (tourism benefits) from the natural and cultural assets (World Bank Group and GFDRR 2017). There are also Willingness To Pay (WTP, to restore a service or good) or Willingness to Accept (WTA, the loss of a good or service) methods that are typically applied to evaluate natural and cultural losses. However, validity depends on the socio-economic, geographical and cultural perceptions of communities (Sangha et al. 2017). Example: In 2015 in Nepal, an earthquake damaged 750 cultural monuments, causing an estimated loss of US$600 million over two years (World Bank Group and GFDRR 2017). |
| Indirect marketable losses: disruption of businesses, communication and network and public services |
Cost of materials and services to restore businesses services using surveys and reports, or the extra costs incurred to meet the public or private needs. Insurance Loss Ratio or multipliers to understand the total costs for different kinds of natural disasters. |
BTE (2001), Joy (1991) and Handmer, Ladds and Magee (2018). Example: In Australia, the total average cost of cyclones, storms and bushfires and other disasters estimated using Insurance Loss Ratio is estimated at $3.65 billion per year (2013 values). |
| Indirect non-marketable losses: health, public amenity, electricity, gas, water services |
Cost of restoring health, public amenity and other services. Indirectly, the number of people who lose access to the public amenities and services or the cost of restoring government services (including compensation to the public) during disruption of electricity, gas and water services can serve as a useful indicator. |
ABRDR&SC (2017), Handmer, Ladds and Magee (2018) applied multipliers and the Insurance Loss Ratio to estimate the total cost and provide no measure of individual non-marketable losses. In addition, WTP/WTA or surveys can be applied to assess the negative health effects of disasters. These costs can be estimated in monetary and non-monetary units. Example: Cost of loss of an urban park can be measured from the number of people who visited the park or its reconstruction costs. |
Results
For the NT, the average (2000–2018) total area burnt by greater than 1 km2 fires was ~250,000 km2, comprising 20 per cent of the entire landscape (Figure 3). There was marked contrast between high and low rainfall regions. Under low rainfall conditions, 83,000 km2 (5 per cent of the region) was affected compared to 166,000 km2 (15 per cent of the high rainfall region). Notably, bushfires greater than 1 km2 occurred on almost 98 per cent of the entire burnt area (Figure 3, Table 2).
To assess the bushfire costs, three scenarios were applied for the loss of ecosystem services from bushfire-affected areas, each of size greater than 100 km2, greater than 10 km2 and greater than 1 km2 for respective dominant land uses (Indigenous, conservation and pastoral) (Table 3). The three scenarios were selected to consider the effect of relatively small (but larger than the prescribed burns that are typically less than 64ha), medium and large bushfires.
For extremely large fires of size greater than 100 km2 (using long-term average fire frequency from 2000–2018), the total costs of bushfires were estimated at $95 million per year (Table 3, Scenario 1). In relation to land-use, bushfires on Indigenous lands cost $72.3 million per year, pastoral $16.5 million per year and conservation $6 million per year. Each value corresponds to the management costs required to maintain the flow of ecosystem services from Indigenous and conservation lands and the loss of pasture production from pastoral lands.
For bushfires of size greater than 10 km2 (Table 3, Scenario 2, which also includes fires of size greater than 100 km2), the total costs were estimated as $132 million per year where the loss was the most for Indigenous land ($100 million per year), followed by pastoral ($21 million per year) and conservation ($11 million per year).
Assuming all bushfires of size greater than 1 km2 (including fires of size greater than 10 km2 and greater than 100 km2) affect ecosystem services and hence people’s wellbeing, the total costs amount to $148 million per year (Table 3, Scenario 3). The bushfire costs for the loss of ecosystem services from Indigenous lands alone were estimated at $113 million per year, followed by loss of production worth $22 million per year from pastoral lands, and loss of ecosystem services worth $13 million per year from conservation lands (Table 3).
Of the three scenarios, Scenario 1 is the most conservative for considering the costs of extremely large bushfires. Given that Indigenous people reside across the remote areas where bushfires occur almost every year and impact on people’s wellbeing, it is appropriate to consider Scenario 2 or 3 for fire extent greater than 10 km2 or greater than 1 km2, that cost $132 million per year or ~$150 million per year, respectively.

Figure 3: The average long-term (2000–2018) fire frequency across the NT for the period (a) 2000–2004, (b) 2005–2009, (c) 2010–2014 and (d) 2015–2018.
Indigenous bushfire costs
When costs are assessed for the loss of services and benefits from large bushfires for Indigenous people living in remote areas, the losses are quite high. The costs were estimated for 35,414 people who live remotely in the NT and visit country once a week (ABS 2016). Applying a substitute value of $7,673 per person per year for loss of wellbeing benefits from healthy country due to bushfires, the total cost is estimated at $272 million per annum (Table 4).
Table 2: Long-term average (2000–2018) burnt area from bushfires varying in extent from less than 1 km2 to greater than 100 km2.
| Average burnt area (km2) from 200-2018 | Less than 600 mm rainfall zone | Greater than 600 mm rainfall zone |
Total burnt area (km2) of the entire NT landscape |
||||||
| Indig- enous |
Conser- vation |
Grazing | Total burnt area (km2) | Indig- enous |
Conser- vation |
Grazing |
Total burnt area (km2) |
|
|
| NA/No fires | 356,222 | 3,822 | 341,586 | 701,629 | 130,410 | 16,928 | 156,902 |
304,240 |
1,005,869 |
| <1 km2 | 598 | 11 | 221 | 830 | 2,880 | 444 | 882 |
4,206 |
5,037 |
| 1–10 km2 | 2,299 | 37 | 946 | 3,282 | 13,656 | 2,171 | 4,283 |
20,110 |
23,392 |
| 10–100 km2 | 6,945 | 91 | 3,781 | 10,817 | 28,888 | 5,290 | 13,378 |
47,556 |
58,373 |
| >100 km2 | 47,419 | 387 | 20,621 | 68,427 | 45,363 | 6,719 | 41,986 |
94,067 |
162,494 |
| % total burnt area | 9% | 1% | 4% | 5% | 14% | 21% | 10% |
15% |
20% |
Table 3: Bushfire costs for the NT for >600 mm and <600 mm rainfall zones (2018 AUD) applying three scenarios for fire extent >100 km2, >10 km2 and >1 km2 using long-term averages from 2000–2018.
| Regions | Greater than 600 mm rainfall zone | Less than 600 mm rainfall zone | Total loss (millions) |
| Scenario 1: burnt area >100 km2 | $95.04 | ||
| Indigenous | $36,986,826 | $35,382,804 | $72.37 |
| Conservation | $334,852 | $5,811,531 | $6.15 |
| Grazing | $5,443,908 | $11,084,314 | $16.53 |
| Scenario 2: burnt area >10 km2 | $132.18 | ||
| Indigenous | $42,404,013 | $57,915,811 | $100.32 |
| Conservation | $413,413 | $10,387,273 | $10.80 |
| Grazing | $6,442,112 | $14,616,027 | $21.06 |
| Scenario 3: burnt area >1 km2 | $147.91 | ||
| Indigenous | $44,197,534 | $68,567,498 | $112.77 |
| Conservation | $445,137 | $12,264,935 | $12.71 |
| Grazing | $6,691,752 | $15,746,842 | $22.44 |
Table 4: Bushfire costs of fires greater than 10 km2 in size on Indigenous lands for Indigenous people in the NT.
| Indigenous land | Indigenous population | Loss of wellbeing benefits due to bushfires ($ per year, 2018 values) |
| 631,863 km2 in total | Total population 58, 238 (ABS 2016) | Assuming Indigenous people in remote locations directly benefit from having connections with country (Social Ventures Australia 2016, Sangha et al. 2017, Sangha, Edwards & Russell-Smith 2019b), there are substantial cost savings for welfare expenditure for keeping Indigenous lands healthy and functional apart from biodiversity, reduced green house gas emissions and other benefits. |
| Bushfires >10 km2 size burn 128, 615 km2 almost every year | 35,414 living in remote locations | Applying a substitute value for only 25% of welfare expenditure savings on three sectors and sub-sectors: a safe and supportive community, economic participation, healthy lives–public and community services ($7,673 per person per year) the total bushfire costs were estimated as $272 million per year. |
Discussion and conclusion
Extensive bushfires burn 20 per cent of the natural landscape in the NT. Costs vary between $95 million and $150 million per year depending on fire extent. To date, there has been no accounting for bushfire-related losses because, unlike southern Australia, there are limited human or infrastructure losses and no measures have been available to account for loss of natural systems nor Indigenous wellbeing. The most well-known sources that report disaster costs in the NT have accounted only for cyclones and storms and not any other disasters. These sources include national-level studies by the ABRDR&SC (2017), Handmer and colleagues (2018), and Ladds and colleagues (2017). This study assesses the broader social and environmental bushfire costs in the NT.
The ABRDR&SC (2017) suggested a total cost of $50 million per year (average from 2007–2016). Using those cost estimates, cyclones and bushfires together cost $200 million per year. Conversely, the loss of wellbeing benefits from bushfires for the Indigenous population is ~$272 million per year (Table 4). If the environmental and Indigenous wellbeing losses are considered together, the cost estimates are ~470 million per year.
This assessment should be considered an under-estimate as:
- Fire mapping archives do not discern fires that burn over multiple dates and so some large fires have not been accounted for (they have been classified as multiple abutting fires). While these larger fires are less numerous than smaller ones, they make up a major proportion of the total area affected.
- Only management costs are considered for maintaining the flow of ecosystem services from Indigenous and conservation estates and gross income losses for pastoral estates. There are significant biodiversity and soil-erosion losses that have not been accounted for.
The effects of large bushfires and the associated losses will occur over a longer-term, especially when fires are extensive and severe. This requires further assessment in relation to fire severity that is beyond this study.
The case study presented here covers only non-marketable losses as there was no loss of infrastructure or other marketable goods or services. However, a mixed set of costs including marketable and non-marketable losses (i.e. dollar and non-dollar measures) are recommended as presented in the framework
(Table 1). The proposed framework is an initial attempt that can be improved on in collaboration with emergency management organisations. In the future, total economic cost assessments can include multiple forms of information to appropriately inform decision making.