Introduction
There is a range of remote sensing technology that can be applied to the task of fire mapping. As identified by the Royal Commission into National Natural Disaster Arrangements in Australia in 2020, ‘There is widespread support for further investigation, improvement and more cost-effective collection of fuel data using remote sensing and satellite technology’ (Commonwealth of Australia 2020, Section 17.10). There is a lot of effort underway to achieve that goal. This paper reviews fire mapping and the potential solutions with the aim to identify ways to improve public safety and fire crew safety. It aims to explain the benefits that may be pursued in the coming years by demonstrating clear examples. It is hoped that improvement can be made before the next serious fire season arrives. Recent events in Canada came only 3 years after their last serious fire season and 4 years since, what was until recently, the worst fire season on record. The catastrophic bushfire events during the eastern Australian bushfire season in 2019–20 are the new record holder by a large margin. The accelerating pace of climate change will affect bushfire frequency and severity and requires that we need to hasten towards better goals.
The task
To define the task, we must start by considering the 2 forms of fire behaviour–steady-state and dynamic. Steady-state fire spread covers the majority of fire events and, because of the training and skills of firefighters, produces a minority of the damage. In risk terms, the likelihood is elevated, but the consequences are minimised, so the residual risk is typically ‘High’ or ‘Very High’ during the fire season. Dynamic fire spread has, until recently, been unusual but has caused a large and rapidly increasing proportion of the damage in areas of eastern and south-western Australia. In risk terms, the likelihood is rare (but increasing) and the consequences can be catastrophic. Thus, in the spring of 2019, the risk in many areas of Australia was assessed as ‘Extreme’, although in other years it is ‘High’.
Steady-state fire spread experience is what the majority of careers in bushfire management have been based on. For example, if you know the terrain, the fuel and the weather, then you can know what a fire would be doing. There are some well-known exceptions to this rule, such as during the growth phase of a fire or during wind direction fluctuations, but it is the core of firefighting and prescribed burn planning. It is also the basis of predictive tools such as Phoenix, Aurora and Prometheus. However, as it is critical to understand the difference between the 2 types of fire behaviour (shown in Figure 1) to assess safety or containment options. It is vital that the correct one is selected. This also highlights the requirement for firefighters to have the suitable skill levels to interpret remotely sensed products. This is beneficial for the firefighter as well as the fire services.
The goal of fire mapping is to plot where a fire has reached at a specified time to match against predictions. If predictions are validated, then mapping generated further into the future increases in credibility.

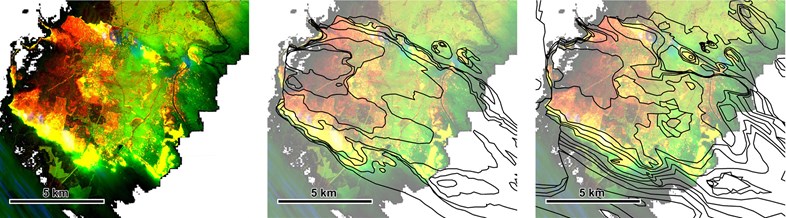
a) Multispectral linescan from 15:37. Compare the yellow (flaming) geometry to that in Figures 2 and 3. Image: NSWRFS
b) Interpretation of the linescan using steadystate spread concepts. Isochrone intervals are variable. Isochrones: ACT Coroner’s Office, by Phil Cheney
c) Interpretation of the linescan using dynamicspread concepts. Isochrone intervals are 10 minutes. Isochrones: ACT ESA, by Rick McRae
Figure 1: Analyses of McIntyres Hut fire on the afternoon of 18 January 2003.
Fire mapping methods
Edge mapping
In its most basic form, edge mapping addresses tactical questions like ‘has it crossed the creek yet?’ An example is shown in Figure 2. A set of grid references are the next more complex form, and these can be provided on a schedule. The fire perimeter can be plotted to a set level of accuracy and precision and can include spot fires.
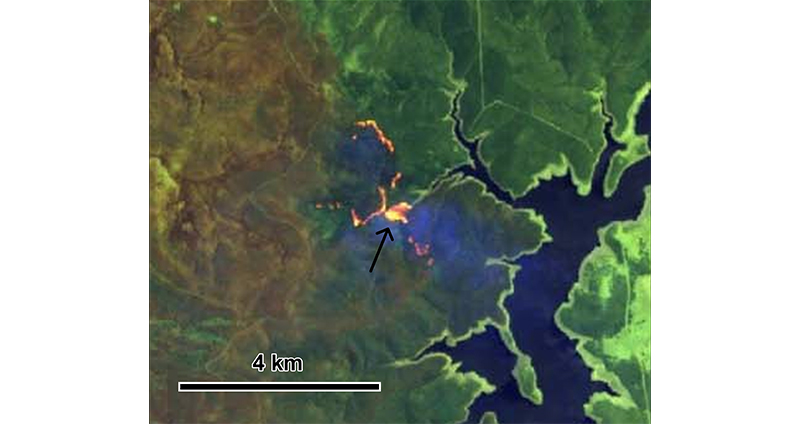
Figure 2: Sentinel 2 image showing that a fire has crossed a watercourse and is joining up with fire on the next ridge. If the latency is low enough (which it was not in this instance), then this is a powerful tool for fire crew safety.
Image: Sentinel Hub
Remote sensing
Remote sensing technology is important here. Aircraft can be used. Air observers are trained to plot fire edges and can relay safety messages directly to ground crews nearby. Increasingly, visual and infrared sensors are combined to generate maps. There are 2 modes of this. For the first, a flight path is flown and a map image produced under that path using the appropriate bands and a fire-edge map is made from that image. These images are called ‘linescans’ (Figure 3) as they are produced by the sensors scanning across the aircraft’s line of passage. In Figure 3, the active fire line is shown as yellow stripes.
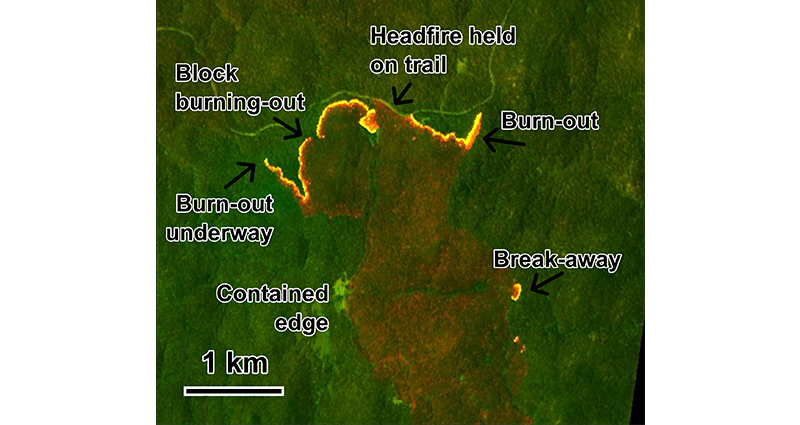
Figure 3: Broken Cart fire, NSW on 17 January 2003. Image: NSWRFS
A newer mode of mapping uses continuous scanning of the area (through the dynamics of the flight path and sensor targeting) to produce a value-added video feed (e.g. Figure 4) back to the incident management team, while referencing the video to the aircraft’s position and orientation to allow identification of significant image elements on the terrain surface.
Both linescanning and video scanning modes allow for repeat mapping. Both are sensitive to aircraft availability and to processing latency (the time between fly-over and data being made available to decision-makers), which is generally quite short. In complex fire situations, the task must reflect the aircraft’s flight altitude options and cruise speeds while operating.
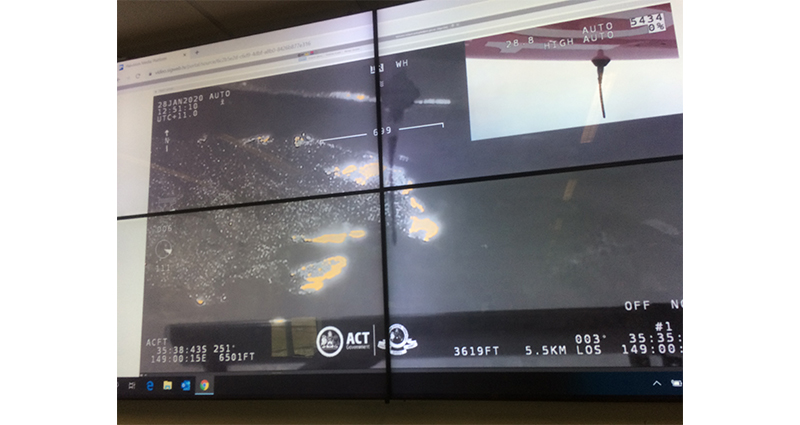
Figure 4: A live video feed from FB100 to the control centre showing active fire.
Dynamic fire behaviour reflects localised feedback that can change due to weather, terrain and the fire. These can, and often do, lead to rapid changes in fire behaviour and rapid decay of the safety of anyone nearby. The fire couples with the atmosphere overhead. Predicting this activity requires understanding of the terrain (in detail), fuel, weather, atmospheric profile above the fire and the fire itself.
A common feature of blow-up fire events is deep flaming. If the flaming zone is no longer a fire line but begins to occupy large tracts of the landscape at one time (see Figure 5), then the coupling is very efficient. There are 7 key mechanisms known to produce this.
The goal for using remote sensing is in 3 parts. Firstly, in predictive mode, we need to know if the fire can enter critical parts of the terrain at times of atmospheric instability. This can be similar to a steady-state mapping task. Secondly, if it has been predicted that precursor events might occur at a certain time and place, then the extent of those precursor events needs to be mapped. Basically, it is confirmation that the fire is entering a dangerous location at a critical time. This is not a task to be done from the fire ground. Finally, there can be instances when a prediction is not feasible. For example, some of the largest blow-up fire events have arisen from the use of drip-torches as specified in an Incident Action Plan.
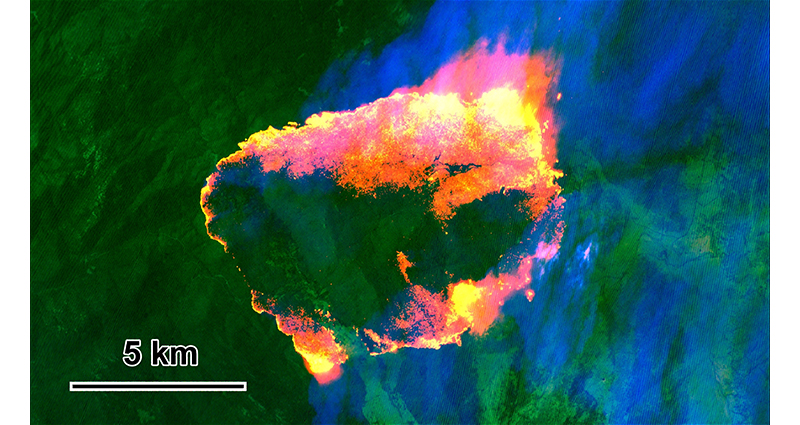
Figure 5: Heat generating areas (yellow and orange) of Orroral Valley fire, ACT, 28 January 2020.
The remote sensing technology might detect the onset of an unpredicted blow-up event. Getting a safety message out as fast as possible is critical. Having an air observer on board, or a skilled intelligence officer in the processing stream is essential, allowing rapid evaluation and confirmation.
It is also possible to use airborne Light Detection and Ranging (LiDAR) technology to map vegetation along the aircraft’s flightpath. Data about unburnt vegetation can be used to assess fuel loads or fuel hazard scores ahead of a fire. Data about burnt vegetation (such as tree canopy removal) can be used to validate ideas about fire behaviour and to guide post-fire damage assessment crews. As vegetation recovers from a previous fire, its potential for carrying fire changes in complex ways. LiDAR offers a way to assess this dynamic (Figure 6) especially in remote areas.
Remote sensing and other satellite capabilities have proven valuable for states and territories to capture nuanced fuel data and aid in fuel management planning and evaluation (Commonwealth of Australia 2020, Section 17.85).There is benefit in states and territories developing and utilising remote sensing and other technologies (for example LiDAR) to improve the capture of fuel load data. (Commonwealth of Australia 2020, Section 17.88)
Airborne Forward-Looking InfraRed (FLIR) pods can scan a fire’s smoke plume up to and above the cloudbase and provide information about the fire interacting with the plume (Figure 7). While the air is normally transparent to infrared, smoke-laden air can be heated by fire below (radiative forcing) in a way that increases its instability and increases indraft winds into the fire. This has potential to form a feedback loop.
Linescanners, using a number of infrared bands, have been used to indicate areas where ember storms are underway and also areas where deep flaming is underway. Ember storms are a product of deep flaming and seems to reflect the reduced oxygen available on a landscape scale. This alters ember burn-out times and ember production dynamics. Ember storm attacks on urban edges are very different to those due to steady-state fires (encoded in AS3959).
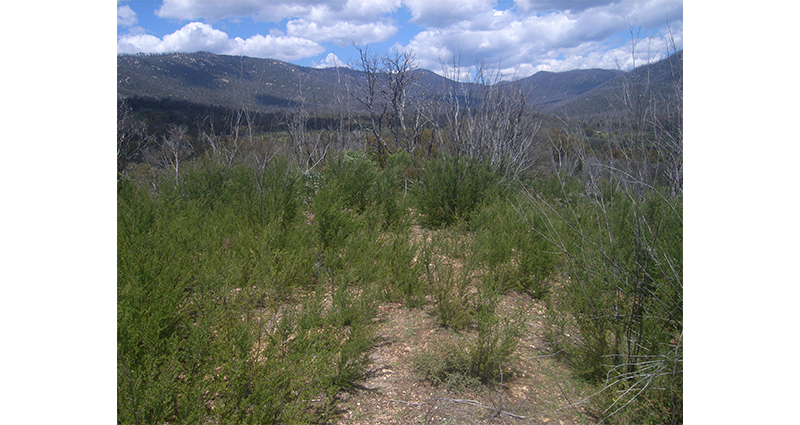
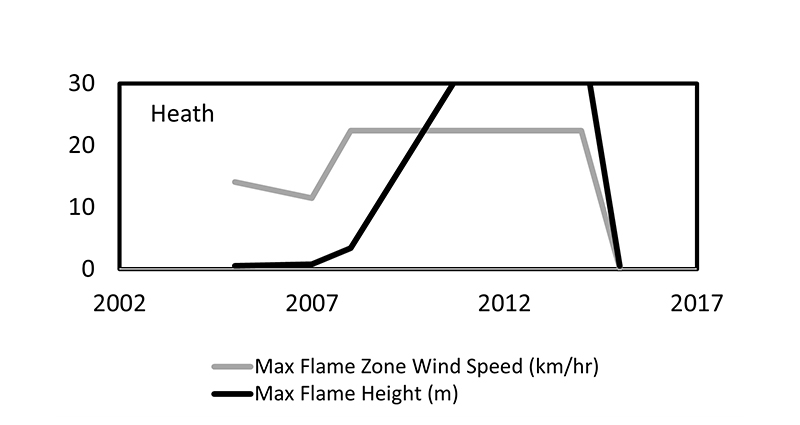
Figure 6: Top left: A stand of tall heath 4 years after a hot fire. Top right: the same stand of heath 5 years later. Graph: changes in fire conditions modelled (using a stylised fire weather scenario) as a result of the regeneration. Airborne LiDAR can be used to identify, track and confirm these changes. Images and analysis: ACT ESA, Rick McRae.
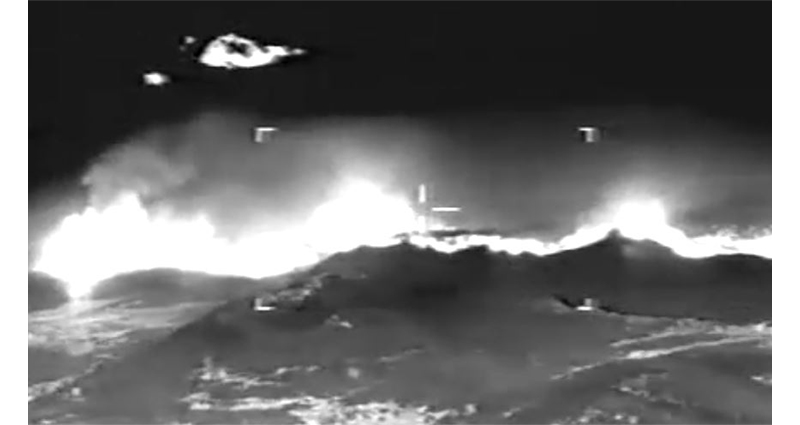
Figure 7: Infrared FLIR pod image of the Alpine Fire Complex, January 2003. The glow of the lower smoke plume indicates that radiative forcing may be occurring. Infrared is also reflecting off an ice cloud in the upper background. Image: Australian Government
The output
Output products are possible using remote sensing technology:
- A fire-edge map at a specified time. Interpretation needs knowledge of the aircraft’s ground speed as the fire may have changed between the start and the end of the mapping run.
- Change in the fire’s extent between mapping runs.
- Fire intensity maps, using:
- Near-infrared bands for a Normalised Difference Vegetation Index or related indices (such as NDBI), or
Fire Radiative Power from satellite hotspots. - Fuel consumption maps using LiDAR to assess changes in surface cover, especially if data for the pre-fire condition are available.
- Fire dynamics.
- Plume dynamics, including violent pyro-convection and ember flows.
- Fuel-state maps, which use satellite data to estimate fuel array and availability.
Aircraft logistics
Fire services agencies have routine access to resources of aircraft, crews and ground support as well as trained air observers to allow for fire extent mapping. Locations with an elevated fire danger rating may have the benefit of a linescanning aircraft being available. There may be resource availability issues based on activities in other locations, recent aircraft and aircrew flight history and air space usage. The more specialised platforms may need access to data links and post-processing capabilities.
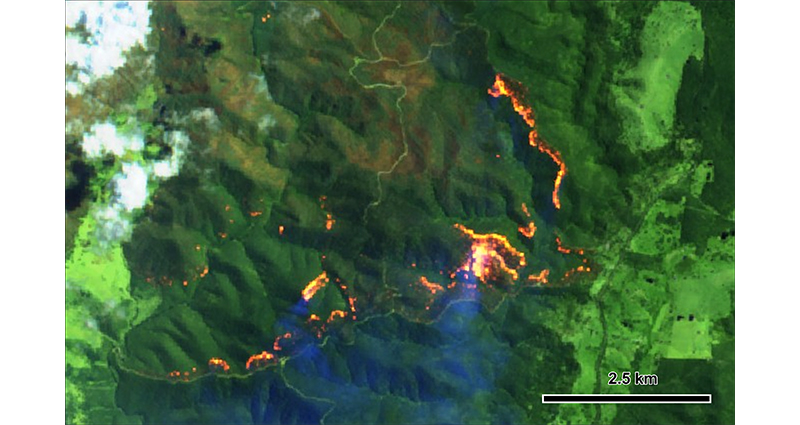
Figure 8: Sentinel-2 image of a backburn near Gelantipy, Victoria, 2 February 2019. Note how well the satellite resolves the fire trails. Image: NSWRFS
The tasking of aircraft needs careful consideration. ‘Bird dogging’ aircraft that are used to guide large air tankers (LATs) to their designated drop targets, may be tactically committed to flying too close to the LAT for them to be a useful source of strategic intelligence. The incident management team’s intelligence processing capability needs to be able to guide all aircraft allocation and tasking.
Some of the most beneficial remote sensing for scientific purposes has come from aircraft (including drones) with long endurance and the ability to stand-off, well away from the operational airspace over and around the fire. Air space usage clashes with operations and intelligence gathering and should be minimised.
In recent years, it has become possible to fill in gaps in linescanning aircraft availability for fires by using Sentinel-2 satellite imagery (Figure 8).
Issues
Australian’s fire season of 2019–20 produced an unprecedented set of fire conditions with large, running bushfires frequently crossing state borders. As noted by the royal commission, ‘There is some variability in capability across jurisdictions’ (Royal Commission into National Natural Disaster Arrangements 2020, Section 17.86). This shows that firefighting arrangements in Australia will need to establish a much higher level of cooperation and coordination between state and territory jurisdictions. The increasing sharing of resources will require national standards for capabilities, logistics, training and products.
Remote sensing products are not colour photographs. They are pseudo-colour imagery and colour assignments are the choice of imagery analysts or, in some cases, agreed standards. Analysts and end users operating in time-sensitive environments benefit from standardised depictions. This also applies to symbology, labelling and marginalia (all of the detailed information in the margins of a map, such as scalebar, coordinates and legend). There is a long-standing tension between ‘zooming-in’ to give the best discrimination of the incident and ‘zooming out’ to give increased contextual information for the remote sensing product (see Figure 9). This needs to reflect whether the end users are viewing the product in a flexible GIS environment or in isolation (e.g. a single image vs. a printout on paper). This may change between incidents and is most significant if capabilities from external sources are deployed. This is especially so if Australian Defence Force resources are used.
Increased resource sharing, assistance from non-emergency management agencies and the need for standardisation, suggests greater oversight role by the Australian Government. This is already in place for space-based remote sensing but is limited for airborne capabilities. Fire events like eastern Australia’s 2019–20 summer bushfires are going to cross state borders. Coordinated intelligence systems can only assist.
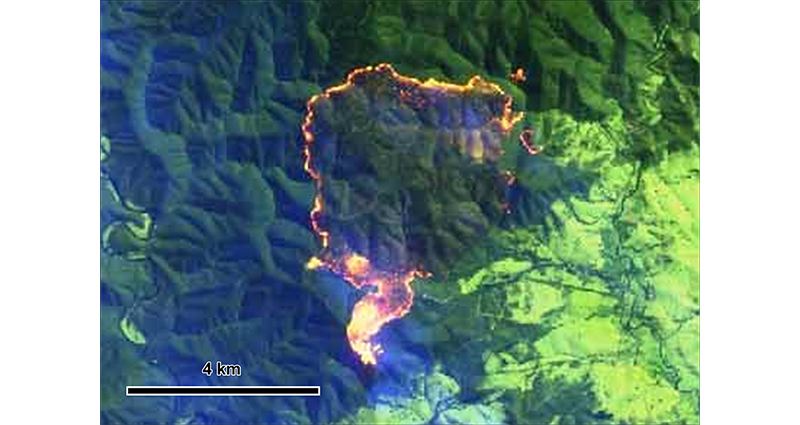
a) A fire with a spot fire adjacent near farms and upwind of a powerline easement.
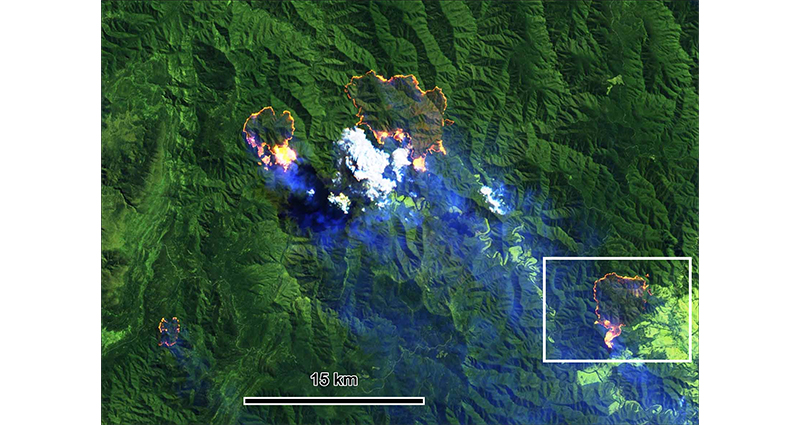
b) The same event (lower right corner) in a larger context, showing a greater level of threat to fire crew safety.
Figure 9: Fire activity near Dargo, Victoria, 4 March 2019. Images: Sentinel 2.
Satellites
For many years, fire analysts have been watching the evolution of satellites that may be useful for fire monitoring. For any satellite, there is a trade-off between the resolution and the repeat time. Satellites can provide images that are roughly detailed enough to be useful every 10 minutes. Some stunningly useful images can be produced but the wait takes days until the next update. Every generation of satellite and sensor (e.g. LANDSAT, AVHRR, MODIS, MTSAT, VIIRS, HIMAWARI and SENTINEL) moves closer to delivering quality and useful images for remote mapping of fires.
Fire hotspots are generated by programs that scan satellite imagery for spectral signatures likely to have come from fires. The backbone of this work for the last 2 decades has been the MODIS sensor on the Terra and Aqua satellites. The 2 together work better than one alone. They are now remarkably nearly 20 years into what were planned to be 6-year missions. Currently, Terra is losing orbital position and is suffering data availability issues. The VIIRS sensor is its replacement and is in satellites called NPP and NOAA20. Together they work better than MODIS. On average a large fire generates 11 times more VIIRS hotspots than MODIS, largely because VIIRS has a better ground resolution. MODIS has a climatology spanning 2 decades, while we will have to wait some years for a VIIRS climatology to build up. For near real-time fire work, VIIRS is a promising approach. Figure 10 is an example of hotspots for a major fire run during the summer bushfires of 2019–20.
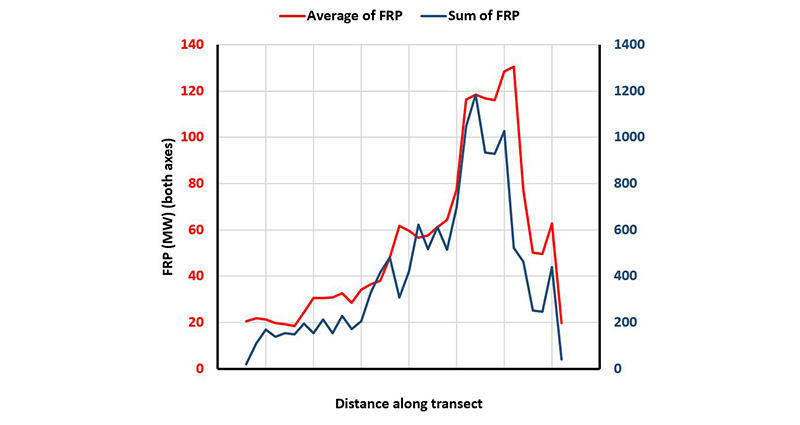
The fire shown in Figure 10 contained 242 hotspots. The hotspot Fire Radiative Power values were aggregated (summed) along that transect into 0.01° segments. The Fire Radiative Power trace along the transect is shown in Figure 11.
Figure 11 shows the hotspots dataset from the 2 VIIRS sensors and provides a snapshot of the fire’s behaviour at the time of overflight (halfway between midnight and sunrise). Analysis shows a likely resolution of a major spotfire about 3 km ahead of the main run. This indicates that there was a major fire run that included dense fire spotting that quickly merged, forming a head fire that took a long time to burn-out (estimated to be about 2 hours). The Y-axis, in Megawatts1, is a reminder of the extraordinary power of large fire runs. Datasets can be downloaded by a GIS operator in the incident management teams and processed quickly to aid production of the next shift’s Incident Action Plan.
The path ahead
What we know about fireground application of remote sensing technology and its future potential indicates elements of the path forward. Any technology needs to be carefully placed in the data-information-intelligence hierarchy if its full value is to be realised. It can become quite demanding during active fire runs to handle a ‘flood of data’ in the correct timeframe to support mission-critical decision-making.
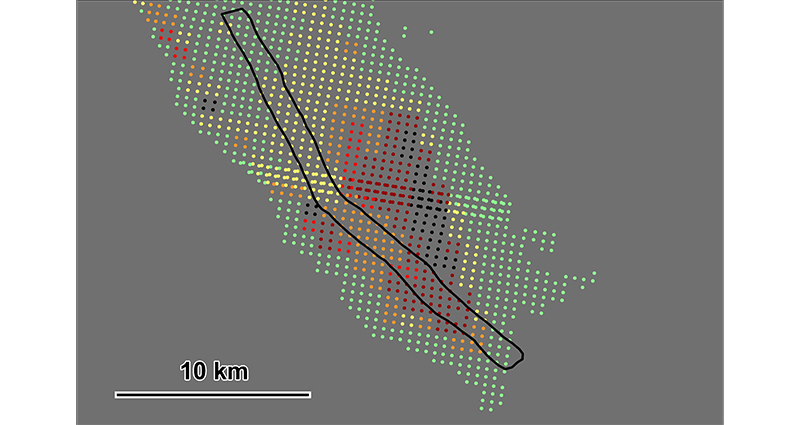
Figure 10: Blow-up fire event hotspot transect, 30 December 2019 with a north-westerly wind. The colour legend is: Green = 0 to 20 MW (Mega Watts), Yellow = 25 to 50 MW, Orange = 50 to 75 MW, red = 75 to 100 MW, Dark red = over 100 MW. Data source: NASA Fire Information for Resource Management System
Useful technologies are constantly changing and offering new options and yet fire operations require training and familiarity with established, mature technologies. No single technology can provide both. Foundation systems must work alongside systems under development, with the balance reflecting operational needs. It is important for a diversity of technologies to be applied to complex fires. The required balance needs to consider both platform availability and processing-interpretation capabilities.
Mature technology needs uptake by all users, including to fire sector leader levels. The increasingly dangerous bushfire environment requires technology to identify and highlight critical evolution of fires. New staff skills need to be introduced and disseminated. The modern fire operating environment relies on interstate and overseas support and poses challenges for firefighter baseline skill sets. Achieving a useful level of commonality will require effective coordination.
It is vital that remote sensing data are used to support scientific exploration of the bushfire environment. New learnings must be incorporated at an ever-increasing pace to keep communities and fire services personnel safe in dangerous fire events.