In recent years, new forms of participatory mapping have emerged that foster the participation of children in disaster risk reduction. Participatory mapping enables children to produce insightful representations of their local area, including their perceptions of hazards, vulnerability and capacities. This caters for a diversity of knowledge and perceptions on hazards and disaster. Such maps provide a way that children can participate in decision-making processes about disaster risk reduction with adults. Furthermore, technology and games using devices such as global positioning systems, mobile phones, digital cameras, virtual reality and video games provide opportunities to conduct participatory mapping with children. This paper reviews different forms of participatory mapping and their purpose and associated strengths and weaknesses in children’s participation in disaster risk reduction activities. Drawing on case studies of participatory Minecraft and LEGO mapping, this paper discusses new opportunities and related challenges to conducting participatory mapping with children.
Children’s participation in disaster risk reduction: what for?
Disaster risk reduction (DRR) should actively involve an array of stakeholders to integrate different forms of knowledge and initiatives and tackle the root causes of people’s vulnerability while improving their capacities to face hazards and overcome disasters. Participation is at the core of DRR and can be thought of as a voluntary process by which people, including those disadvantaged, marginalised or excluded from mainstream debates and actions, can shape or control the decisions that affect them (Saxena 1998). Since the 1990s, academics, practitioners and policy makers have advocated for the participation of children and young people1 in DRR (Hart 1992; Sinclair 2004; Mitchell, Tanner & Haynes 2009, Lopez et al. 2012). Children have relevant knowledge about natural hazards such as floods, fires, tsunami or earthquakes in their surrounding area (Peek et al. 2018). They are creative and knowledgeable about local capacities such as emergency services and resources in their neighbourhood. Children can identify those most vulnerable in the place where they live including people with disabilities, the elderly, homeless people and households highly exposed to natural and other hazards. They are able to engage in disaster risk assessments and should participate in the initiatives geared towards DRR (Mitchell, Tanner & Haynes 2009).
Nonetheless, children’s participation in DRR rarely takes place for many reasons. Adults tend to perceive children as weak and passive in the face of hazards, not as potential contributors of DRR (Wisner et al. 2018). Children’s knowledge is usually related to the areas where they live, reflects cultural values and is rooted in their social practices and customs (Peek 2008, Walker et al. 2012, Mort et al. 2008). Making children’s knowledge tangible, usable and communicable to outside stakeholders (i.e. government agencies, scientists and non-government organisations) and adults living in the surrounding area is therefore challenging. Children are also not a homogeneous group but vary in age, ethnicity, socio-economic level, geographic location, learning capacities and interests (Sinclair 2004, Lopez et al. 2012). Practitioners often lack appropriate tools to effectively foster diverse children's participation and cater for such diversity.
Participatory mapping has emerged as an effective way to foster children’s participation in DRR. Maps are a compelling tool that gives visual expression to realities that are perceived, desired or considered valuable, thus providing means for communicating information beyond the realms of those who produce them (Chambers 2008). Different forms of participatory mapping have traditionally been used for DRR, including ground mapping, sketch mapping, 2-D scaled mapping, Global Positioning System (GPS) mapping and interoperable Geographical Information System (GIS) mapping (Cadag & Gaillard 2012). Recent advances in technology with devices such as mobile phones, digital cameras, tablets, virtual reality and video games provide new opportunities to conduct participatory mapping with children, yet, these remain largely unexplored. This paper reviews existing forms of participatory mapping, its purpose and associated strengths and weaknesses for fostering children’s participation in DRR. Drawing on case studies of participatory Minecraft and LEGO mapping, this paper discusses new opportunities and related challenges to conducting participatory mapping with children.
Participatory mapping with children: a review of approaches and tools
Different approaches to participatory mapping have been used to foster the participation of children and other marginalised groups in DRR (e.g. Wisner 2006; Bartlett 2008; Manyena, Fordham & Collins 2008; Molina et al. 2009; Gaillard & Pangilinan 2010; Shiwaku & Fernandez 2011; Gaillard, Hore & Cadag 2015; Ronoh, Gaillard JC & Marlowe 2015; Crocetti, Tofa & Petal 2018; Plan International 2018). Table 1 provides a non-exhaustive list of these approaches, which include ground mapping, ‘stone mapping’, sketch mapping, mapping on aerial photos or satellite images, balloon and kite mapping, GPS mapping, drone mapping and interoperable GIS mapping.
Ground and stone mapping are easy to conduct and are flexible and playful forms of participatory mapping. They require limited resources such as sand, stones, leaves and branches that can be found wherever participatory mapping is conducted. Children can use these materials to draw features on the ground, identifying hazard-prone areas and important local resources. These resources may be vulnerable to natural hazards but may provide invaluable capacities to local people. These forms of participatory mapping are ephemeral and dependent on environmental conditions such as wind, rain and tide.
Practitioners of DRR often rely on sketch maps when helping children participate in DRR. Children use marker pens to draw spatial features on large pieces of paper. These activities are easy to conduct, colourful and permanent. However, these maps hardly facilitate the integration of children’s knowledge, resources and skills with those of adults, especially people from outside the area being mapped. Sketch maps, as well as ground and stone maps, are neither scaled nor geo-referenced (i.e. associated to specific locations on the Earth’s surface through longitude and latitude coordinates). This may lead to these maps being dismissed by adults, government organisations and scientists who may challenge the relevance and accuracy of the data.
GPS, interoperable and GIS approaches to participatory mapping are often designed to overcome these issues by using maps that are scaled and geo-referenced. However, they require technological resources that are not always available. They are also complicated to initiate and may prove difficult for children to take the lead. When successful, children draw hazard-prone areas and identify people and resources using a balloon, a kite, a drone, a GPS device or directly onto an editable map available on a web-based platform. These forms of participatory mapping rely on GIS that may not be available locally nor accessible to children. Furthermore, data are often stored, analysed and used by adults who have control over the database.
Since 2000, Participatory 3-Dimensional Mapping (P3DM) has emerged to address the challenges of other forms of participatory mapping. Children can build large, stand-alone and scaled relief maps using locally available and cheap materials (e.g. cartons, paper, cork) over which they add thematic layers of spatial information. Using push-pins (points), yarn (lines) and paint (polygons), they can plot topographic landmarks, land cover and use, hazard-prone locations as well as social and cultural features to capture people’s vulnerabilities and capacities. P3DM provides children with a tangible basis to discuss disaster risk and actions with adults. However, it often requires external facilitation, especially to produce the initial base map that is often alien to children and may take time to prepare.
An array of quicker and less demanding approaches has been derived from fostering children’s participation in DRR through P3DM. To hasten the process, facilitators can pre-prepare a base map upon which children plot and delineate spatial information, including hazard-prone locations and features that reflect people’s vulnerability and capacities, using push-pins and yarns. A similar approach may be taken on printed aerial photographs and satellite images of places children are familiar with.
All these approaches have strengths and limitations and none should be considered as a silver bullet in conducting participatory mapping with children. The choice of the most appropriate tool and approach is guided by the local context, the time available and the objectives of the activity. New approaches developed since 2015 broaden the available opportunities.
Table 1: Types of traditional participatory mapping and their strengths and weaknesses.
| Types of participatory mapping | Principles | Strengths | Weaknesses |
| Ground mapping | Children draw the map in the sand or on the ground with a stick or their fingers. |
|
|
| Stone mapping | Children draw the map using stones, branches, paper and other locally available materials. |
|
|
| Sketch mapping | Children draw the map on a sheet of paper with coloured marker pens. |
|
|
| GPS mapping | Children walk around the area to be mapped and plot features with GPS. Data are eventually included into a GIS. |
|
|
| Balloon and kite mapping | Children use a camera attached to a balloon or kite to capture aerial photographs. Data may eventually be included into a GIS or overlaid on existing maps. |
|
|
| Drone mapping | Children use a camera attached to a drone to capture aerial photographs. Data may eventually be included into a GIS or overlaid on existing maps. |
|
|
| Web-based and interoperable GIS mapping | Children contribute to a web-based GIS database using their own computer. |
|
|
| Scaled 2-D mapping | Children draw a scale-based map of their place and plot spatial data with push-pins and yarns. |
|
|
| Aerial photograph or satellite image mapping | Children plot spatial data with push-pins and yarns on top of an aerial photograph or a satellite image of their place. |
|
|
| P3DM | Children build a 3-dimension model of their place with locally available materials. They then overlap thematic layers of geographic information. |
|
|
Exploring new opportunities through Minecraft and LEGO
Participatory mapping using LEGO and Minecraft tools are exploratory and the strengths and difficulties associated with their implementation are highlighted. In this case study, participatory mapping with childrentook place in a school in rural New Zealand. The local area is isolated with limited to no mobile phone coverage. The local people are exposed to drought, bushfires, earthquakes and floods. In 2007, children and teachers were evacuated after the school was flooded. As such, the local school was very interested in taking part in a participatory mapping initiative. This involved technology and games such as Minecraft and LEGO that could be integrated into the school’s disaster education stream. A total of 90 students from Year 5 to Year 8 (aged 8–13 years) was involved. The students could choose smaller ‘project groups’ from which they could participate in Minecraft and LEGO mapping. A total of 13 children, aged 10–12 years, took part in the participatory mapping with LEGO and 20 children, aged 8–11 years and 11–13 years, chose participatory mapping with Minecraft. The other students chose activities such as filming, 3-D printing or robotics. Both initiatives were balanced in terms of gender and ethnicity. This research received ethics approval from Auckland University of Technology (#17/263).
Rationale and description of the process
Minecraft and LEGO were chosen based on their popularity with children. Both offer opportunities to map physical and social features in a creative and playful way. In May 2019, Mojang, developers of the bestselling video game Minecraft, announced that 176 million copies of Minecraft had been sold worldwide (Persson 2019). LEGO is a symbol of childhood in western culture. LEGO started in Denmark with wooden toys in 1934 and became most famous for its building bricks. Over the past 20 years, LEGO has expanded its products to engage children and foster their creativity. This has included LEGO Mindstorms as well as movies, cartoons and books. LEGO has also featured in TV reality shows, for example LEGO Masters Australia and international contests such as the LEGO league.
Before any mapping could start, several participatory activities were conducted to reflect on previous hazardous events and discuss what and who was affected. The purpose was to identify children’s knowledge about their surrounding area and build dialogue and trust. It was also to discuss aspects that are central to participatory mapping, including scale, elevations and the information that would be plotted on the maps with features like hazards, vulnerabilities and capacities. Once the information was defined, actual mapping commenced.
For Minecraft, the researchers produced a geo-referenced and scaled Minecraft world that provided an initial spatial environment ready for students to map the local area and plot information they identified. This base layer included building outlines, elevations and other geographical features and characteristics such as roads and rivers. All geospatial input data was freely available from Land Information New Zealand with no usage restrictions. Due to server limitations, a maximum of 14 avatars (in-game representations of the player; two children could be represented by one avatar) could be hosted simultaneously to play and build within the Minecraft game world.
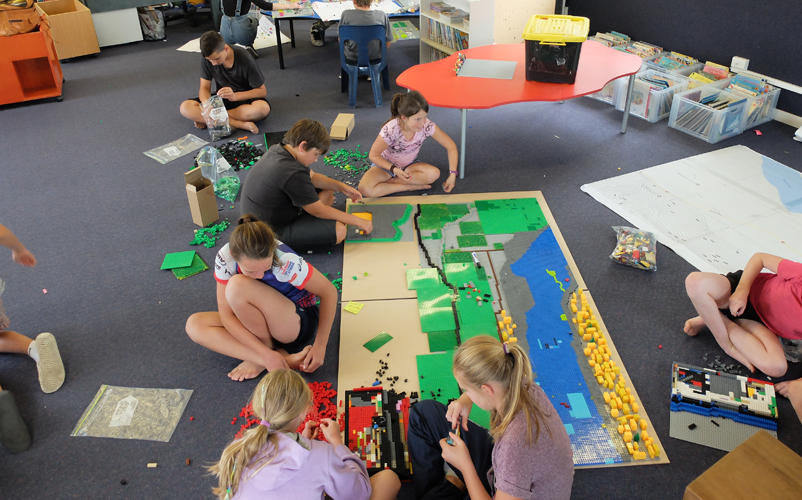
LEGO participatory mapping with children in New Zealand. Image: Loïc Le Dé
Three participatory Minecraft mapping trials were conducted with varying processes as informed by the Beyond Stop Disasters 2.0 research (see Gampell et al. 2020). Children in the first trial had limited guidance from facilitators and were provided with past information and paper maps from earlier sessions to help plot information. The second trial included more hands-on guidance and provided children with targeted building goals taken from their earlier activities alongside the paper maps. The third trial allowed children to work with minimal guidance with access to earlier material if they wanted.
Debriefing sessions occurred halfway through each trial. These sessions showed progress and were an opportunity for the children to reflect and correct any misplaced buildings and hazards. Children involved in all three trials wrote on in-game signboards next to their creations to identify what they had built and connected these to categories of hazards, vulnerability or capacities. For example, a fire station was identified as a capacity that could provide resources and skills in the face of natural hazards, like wildfire. At the same time, the children identified that the fire station was a vulnerable asset because it was located close to a flood zone. Children examined their maps at the end of each session through group discussions lasting 5 to 10 minutes. They could provide anonymous feedback to the facilitators via a ‘Stop-Go’ jar that was left in the classroom and collected at the end of each session. Students could provide feedback about things they enjoyed and things they wanted the facilitator to stop doing. A final session using a Strengths, Needs, Opportunities, Challenges (SNOC) analysis and participatory ranking method was conducted so children could provide feedback on the overall process and its outcomes.
For LEGO, a base map with elevation contours of 190 cm x 114 cm representing an area of 3.12 km x 1.92 km was printed. These were the ‘community boundaries’ identified by the children. For this exercise, children could produce a geo-referenced and scaled 3-dimensional map of the surrounding area, including their school. Children then overlayed the LEGO base plates on top of the topographic map, creating grid lines for each base. Each child then chose a LEGO base plate to work on. Each session lasted about 90 minutes. At the start of the session children collectively discussed how they would work as a group, self-assigning the tasks and responsibilities. At the end of each activity they reflected on the process and the tool, identifying strengths and difficulties and ways to overcome them. The LEGO map took a total of 12½ hours of building time to complete and used an estimated 30,000 LEGO bricks.
Table 2: Outcomes and challenges of participatory mapping using Minecraft and LEGO.
| Positive outcomes | Challenges | |
| Participatory LEGO mapping | Active participation since the process was fun and enjoyable. All children were familiar with LEGO so they could take ownership over the process. Inclusiveness of participatory LEGO mapping engaged children of different ages, ethnicity, gender and capacities. Children became ‘experts’ using LEGO mapping and were equipped with the data produced and the tool. Children’s knowledge became tangible and communicable to outsiders. |
High number of bricks required added to cost. Takes time to build the base map, which can affect the participatory process. Children’s ages needs to be considered. Shape of LEGO bricks can limit the reproduction of features to scale. LEGO bricks require logistic and space to build and to store large maps. |
| Participatory Minecraft mapping | Process is fun, active and engaging. Children’s familiarity with Minecraft allows ownership over the process. Requires creativity, dialogue and critical thinking and making sure children work as a team. A tangible outcome is created, built from the understanding of children. Can transcend boundaries allowing play in school, home and the community if technological resources are available. Does not require physical storage. |
Technology can prove difficult – firewalls, software updates, server connectivity – pro-action and knowledge to overcome these issues is needed. Costs for the software, device but also time. Geo-referenced base layer but outcomes can show scale and accuracy issues. Inside the world can be difficult to orientate without references. Age can change the gameplay, leading to how to deal with social interactions both inside and outside Minecraft. How to connect Minecraft with external stakeholders who may be as familiar as children. |
Note: the information in the table is based on children’s and teachers' evaluations using focus group discussions alongside researchers’ reflections on the overall participatory mapping process.
Outcomes of this participatory mapping
Minecraft and LEGO are engaging, playful and stimulating tools for children to identify and map potential disaster risks in a participatory way. Trialling Minecraft and LEGO in a rural community in New Zealand sparked children’s interest and enabled ‘handing over the stick’ to children with the mapping process. All the children involved in these activities had prior experience using Minecraft and LEGO. This familiarity with the tools meant children could confidently contribute to the mapping process. In a way, the children were the ‘experts' as they generally had more and recent experience with Minecraft and LEGO than the facilitators. Participatory mapping using Minecraft and LEGO enabled children to demonstrate andhare their knowledge as well as build social connections and collaborate with peers. When finalised, the maps were a platform for dialogue about DRR with teachers, local people and practitioners. Children could share ideas about DRR planning and evacuation scenarios for their school and other local areas.

Participatory mapping using Minecraft where children built their school and surrounding area. Image: Anthony Gampell
Challenges of this participatory mapping
The opportunities associated with these participatory mapping tools posed a number of challenges for both children and facilitators (see Table 2). The benefit of producing a LEGO map is that it can be taken apart and reconstructed. As such, the school could reuse the exercise in beneficial ways, for example as an interactive teaching tool. However, a challenge identified by children was the limited availability of the LEGO bricks to reproduce geo-referenced features. The pre-determined shape and size of the bricks made it difficult to accurately reproduce the contours in the landscape and the elevation of the hills. However, this stimulated group discussions and made the children work together to reach a consensus on how they would overcome such issues. For the teachers, the main difficulty related to the number of sessions required to complete the LEGO map. From a researcher’s perspective, the biggest challenge was the logistics, particularly in sourcing LEGO bricks of the same colour and size.
Using the Minecraft ‘game world’ allowed for easy moving of elements in cases of inaccurate information plotting. However, without the visual cues of the outside world, children found it difficult to know whether they were in the right location and this affected accuracy and scale. Using technology has issues related to server capacity, connectivity, software updates and firewalls that require facilitators to be knowledgeable and proactive to overcome any challenges. Teachers may not be able to dedicate adequate time. There is also cost involved to purchase the software. This is, however, a one-off cost and provides near limitless building potential without the need for physical storage space. In addition, popular culture changes over time and other games may grow in popularity and Minecraft may become considered as ‘old’, though this may not always affect children’s levels of engagement.
Conducting participatory mapping in a school setting presented challenges to achieving genuine participation. For example, the participation of the children was required due to it being part of the school curriculum. To overcome this, the students could choose other project teams (e.g. filming and 3-D printing) and could opt-out at any stage during the process. Facilitators strived to create an environment that was informal and had flexibility compared to more traditional classroom settings. Nonetheless, some of the challenges associated with participatory mapping in a school setting were difficult to overcome. For example, when children decided they should also conduct participatory mapping outside scheduled times (i.e. weekends and after class hours). This was rejected by the school as it required the presence of teachers. Such a challenge is not linked to participatory mapping with LEGO and Minecraft, but with any participatory project conducted within a school environment.
Participatory mapping 2.0: opportunities for children’s participation in DRR
Participatory mapping using evolving technologies offers a myriad of options that are still to be tested. For example, mobile phone applications provide relevant means to conduct participatory mapping as they can update and upload real-time information about hazards, vulnerabilities and capacities. Most children and parents in Australia and New Zealand are familiar with mobile phones. These are affordable devices that connect multiple users simultaneously. Virtual reality and augmented reality have also become affordable options to conduct participatory mapping. For children, these tools are playful and engaging and can map large geographical areas and have the potential to include scenarios of tsunamis, floods and earthquakes.
Participatory mapping tools, games and technology can also be combined in a creative and effective way to suit objectives. As an example, participatory 2-D mapping can be combined with LEGO bricks for land-use planning (e.g. adding bridges, roads and buildings on an existing 2-D map). The possibilities for conducting participatory mapping with children has great potential and application.
The choice of tools and materials to conduct participatory mapping with children should not be guided by the desire to create a nice map nor for the sake of innovating, but by the available time, budget, age of the children and objectives of the project. Particular aspects should be considered when conducting participatory mapping with children:
- The technology, game or material used for participatory mapping needs to be available locally and be socially and culturally suited to the local context. For instance, LEGO, Minecraft or virtual reality might be highly relevant in a certain context and unsuitable in another.
- Maps need to be understandable and usable by potential audiences (children, adults, DRR practitioners, teachers, scientists, etc.).
- Participatory mapping needs to be enjoyable and fun as children’s participation is enhanced when play is encouraged.
It is essential that any participatory mapping initiative, whether it is traditional or 2.0, is not an end and should not be conducted with the sole objective of doing participatory mapping. The aim is to facilitate the exchange of information and dialogue between children and adults in their community, DRR practitioners and researchers (Gaillard & Mercer 2013). Children’s knowledge is often regarded as inferior compared with that of adults and children may not have the same competence in communicating as do adults. However, this does not mean that the contribution of children is invalid and that they cannot participate in the decision-making process related to DRR. Participatory mapping 2.0 seeks to equip children with information, knowledge and the tools needed to help them communicate better with adults, including practitioners and policy makers.
Assessing the outcomes of a participatory mapping initiative can be difficult as many outcomes are intangible and may not match with outsiders’ agenda, existing expectations or reporting templates. However, measuring the outcomes of participatory mapping should focus on:
- active participation of children, allowing for diversity of age, background, ethnicity and education
- fostering children’s learning and awareness about their knowledge of hazards and disasters
dialogue between children and with adults - equipping children with the knowledge and tools to participate in decision-making for DRR.
Both traditional and newer ways of participatory mapping can be combined with other participatory approaches and techniques, especially to capture the more intangible aspects of hazards, vulnerabilities and capacities. These include social networks, transnational exchanges and temporal patterns, which are difficult to plot on a map. In addition, as for any participatory tool, the contribution and sustainability of a mapping initiative depends on the process of participation and the respect for children’s concerns and aspirations. Children should be involved in every stage of the process, from choosing the tool to analysing the data as well as evaluating the outcomes of a participatory mapping project.