Fire behaviour is changing as new modes of fire spread dominate in south-eastern Australia, making extreme bushfires significant risk drivers during bad fire seasons. This is linked to changes in climate and landscape hydrology. A Hierarchical Predictive Framework has been developed specifically to predict the risk of extreme bushfires in south-east Australia. It uses temperature anomalies and the accumulation of river drying events to predict seasonal risk. If that risk is raised, a Blow-Up Fire Outlook model looks at fire weather forecasts and fireground context for specific risk prediction. This guides operational intelligence gathering to support decision-making by incident management teams. The Hierarchical Predictive Framework is based on over 20 years of archival data on extreme bushfires and their context. It is intended to work alongside, but not replace, existing operational systems. Tools like the framework can help keep fire crews safe in the face of risks like branched troughs and the rapid rise in prominence of foehn-driven fires in Australia, as well as the rapidly growing threat from fires that spawn pyrocumulonimbus clouds (pyroCbs).
Introduction
Through the 1980s and 1990s, fire agencies in Australia put significant effort into using the El Niño-Southern Oscillation Index as a seasonal outlook tool. It measured reversing seas surface temperature gradients across the equatorial Pacific Ocean that affected weather patterns on a hemispheric scale. This work was supported by development efforts by the Bureau of Meteorology1 and by the media in the reporting on approaching fire seasons. It worked well and is still widely used.
El Niño years were hot and dry (although not necessarily windy) and produced bad fire seasons. La Niña years were the opposite and these 2 states typically defined the maximum and minimum conditions facing fire services. After the 1997 El Niño event, the climate across the south-east regions of Australia began changing. In places like Canberra, the average temperature has risen over 3 degrees Celsius, while summer temperatures have risen by more (see Figure 1). This upward trend has major annual variations imposed on it, so a year that falls on the trendline may now exceed the pre-1997 El Niño peaks while a year warmer than the trendline may set new records.
Widespread firefighting operational challenges were experienced during the Australian summer bushfires in 2019–20 and suggest that the fire climate ‘rule book’ has been rewritten. New fire types are occurring with increasing frequency. PyroCbs are fire thunderstorms that form in violent pyro-convective plumes and these are increasing in frequency (McRae 2022) (see Figure 2). While fires driven by the foehn effect (hot, dry winds coming off higher terrain) were novel a decade ago (Sharples et al. 2010), they are around half of the major events that occurred during the Australian summer bushfires in 2019–20. It is clear that new tools are required.
To support adaptation, a Hierarchical Predictive Framework (HPF) has been developed. This takes lessons from recent research into extreme bushfires that have occurred and draws on long-established knowledge to show strong linkages that allow effective predictive services. Figure 3 shows the framework. It operates on a range of temporal scales, each requiring different concepts. As the fire season gets closer, the scale shrinks and new concepts are applied, producing a nested set of alerts leading up to the tools needed by an Incident Management Team to keep communities and fire crews safe.
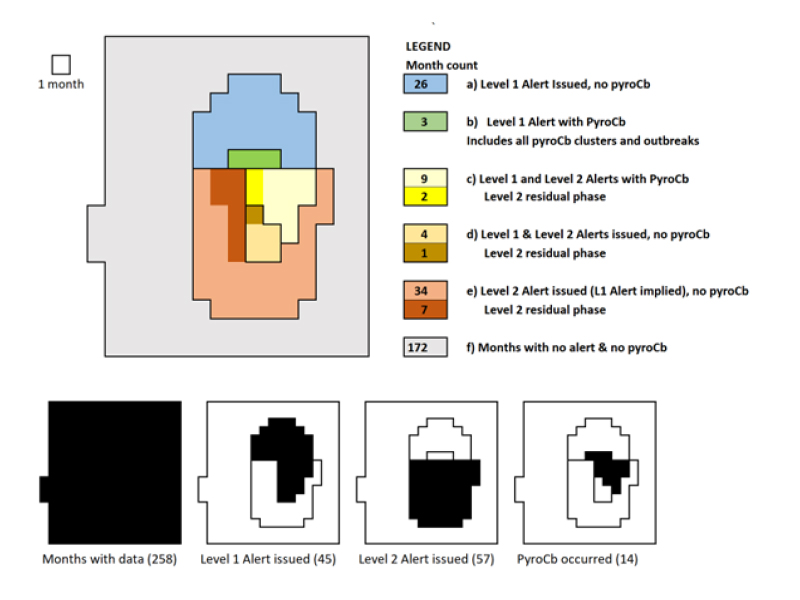
The framework has been applied retrospectively to assess its performance. Levels 1 and 2 have been applied to more than 2 decades of data. Level 3 has been partially assessed using data from the Australia’s 2019–20 bushfires land temperature anomalies. This paper describes the framework and reports the results of analysis. It shows that the hierarchic approach works well and that the HPF may be an effective operational predictive tool.
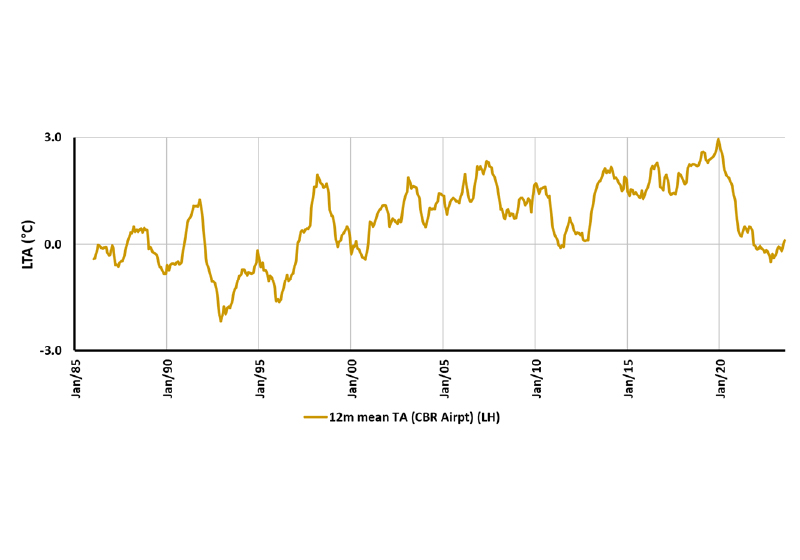
Figure 1: Trends in land temperature anomalies at Canberra airport.
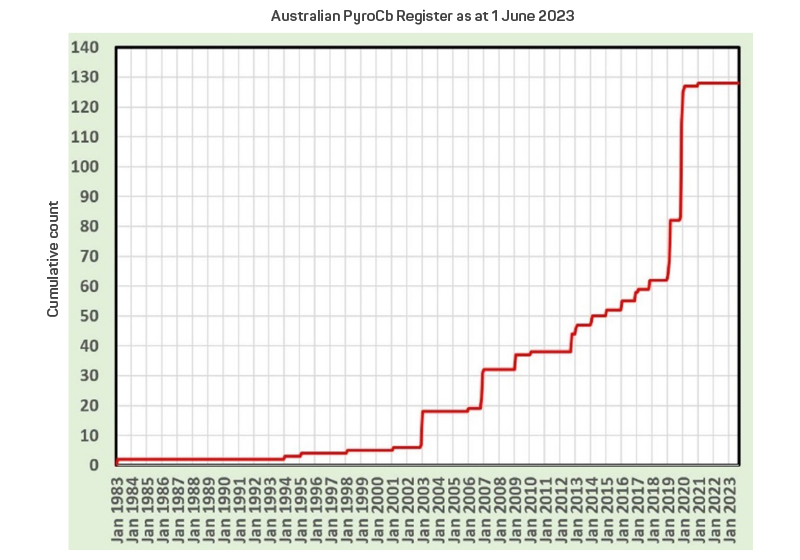
Figure 2: The Australian PyroCb Register, at www.highfirerisk.com.au/pyrocb/register.htm.
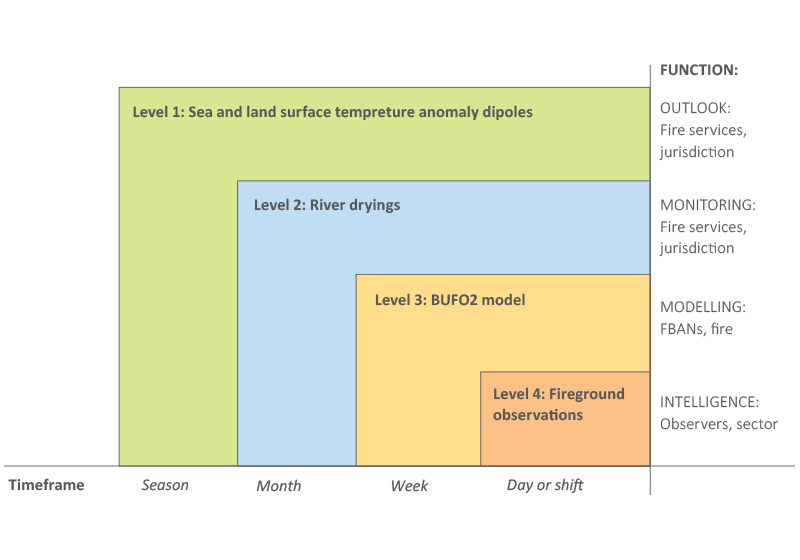
Figure 3: Schematic structure of the HPF showing the linkages between spatial and temporal scales.
Method
With the goal of predicting the potential for the most damaging class of bushfire, the HPF presented here is based on observations of environmental variables. These are brought together in a way that uses 4 levels to provide closer scrutiny if that potential increases. It is designed to support fire service operations.
Level 1
A Level 1 alert is an early monitoring stage alert. Sea surface temperatures (SSTs) started being recorded after the 1983 El Niño event. This was based on buoy and satellite imagery. A climatology of expected SSTs was developed and this is subtracted from the latest observations to derive SST anomalies. Maps were produced by the US National Oceanic and Atmospheric Administration and have been available online. The HPF uses SST anomalies averaged over a 12-month period.
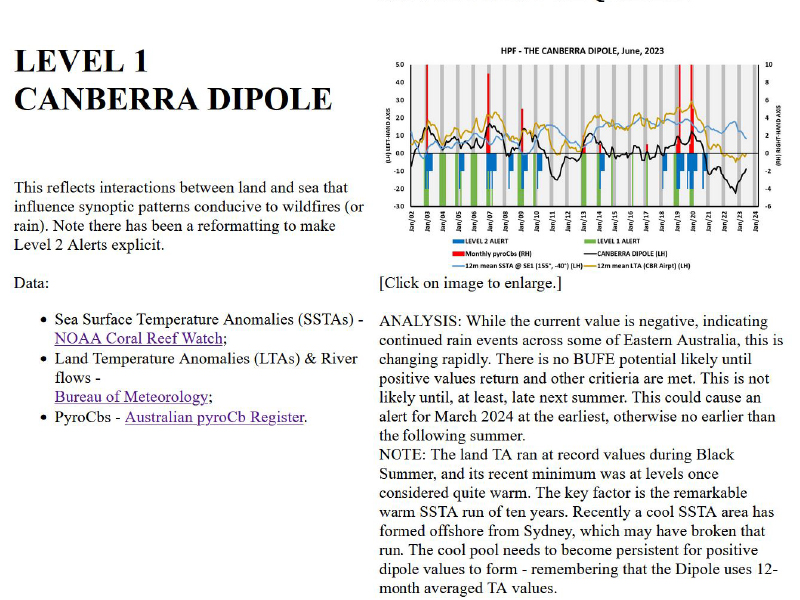
Most blow-up fire events in eastern Australia are in the forests near the coast as well as in the highlands between Melbourne and Brisbane and into Tasmania. A convenient central reference site was selected at Canberra airport within the Australian Capital Territory. Land temperature anomalies are averaged over 12 months in the same way as the marine ones using a Bureau of Meteorology climatology. The difference between the 2 averaged anomalies is termed the ‘Canberra Dipole’ and is the basis for a Level 1 alert that is issued if the dipole is positive and increasing heading into or during summer.
Figure 4 shows that there has been a radical swing from the heat of bushfires in the 2019–20 fire season into the flooding conditions of the following years. At the time of writing, the black line showing the Canberra Dipole is climbing and there is a potential for a Level 1 alert in either the next summer or the one after. Events from early 2002 leading up to severe bushfires in Canberra in January 2003 suggest that a 9-month lead-up may be required from the current similar situation, suggesting March 2024 is the earliest date.
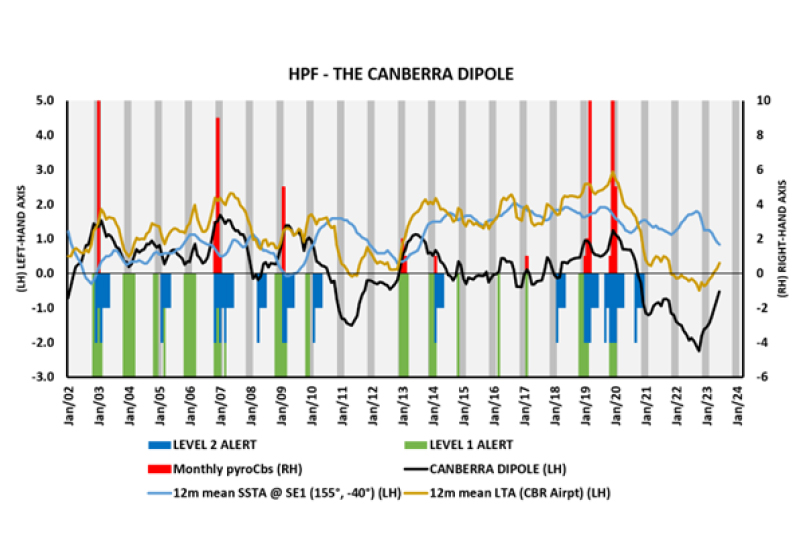
Figure 4: A sample plot of the Canberra Dipole showing the transition from negative values towards zero and positive values in the coming months. Level 2 alerts distinguish the accumulation phase from the ensuing residual phase.
When positive, the dipole shows the potential for land temperature anomalies to affect synoptic patterns that produce complex trough systems onshore that are involved in most extreme bushfire events. An example is shown in Figure 5, which is an image taken 5.5 hours before the end of 2019. Overlaid are isobars derived from observed air pressure (QNH2, black lines), inferred trough-lines (based on observed QNH and wind vectors, black dashed lines) and the sea breeze edge (based on dew point temperature gradients, white dotted line). The complexity of the trough system affects fire weather.
It must be remembered that the bushfires in 2019–20 in New South Wales included severe drought, heatwave and raised dust events. The dipole also shows, when negative, the potential for flooding events. Thus, the dipole gives insight into some of the most elevated risks faced by communities.
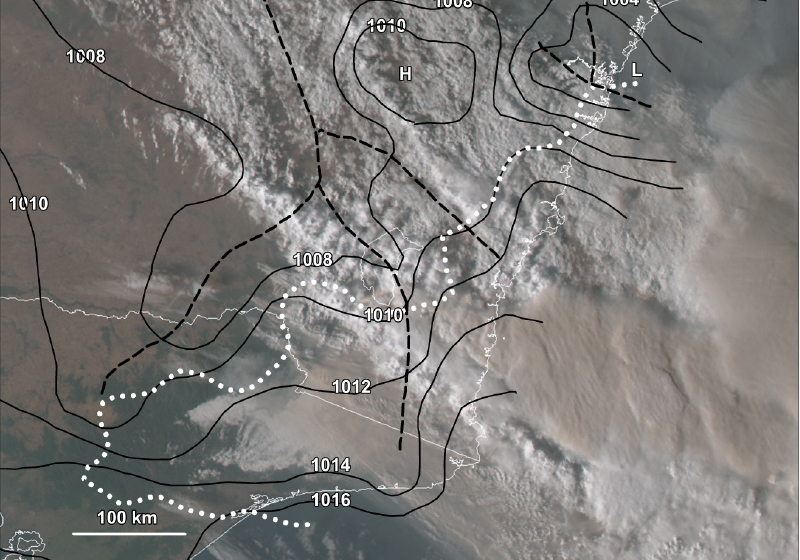
Figure 5: A Himawari-8 satellite image of extreme pyro-convection over south-east Australia.
Level 2
A Level 2 alert relates to the assessment of soil hydrology. Many tools have been developed to assess the dynamics of moisture exchange between soil and fire fuel lying on the ground and these have long been used operationally. This includes a Drought Factor used in the McArthur Forest Fire Danger Index and equivalent measures in Mount’s Soil Dryness Index. In recent decades, satellite-based systems have been developed. While these show the flammability of fine fuel, they say little about larger fuel types.
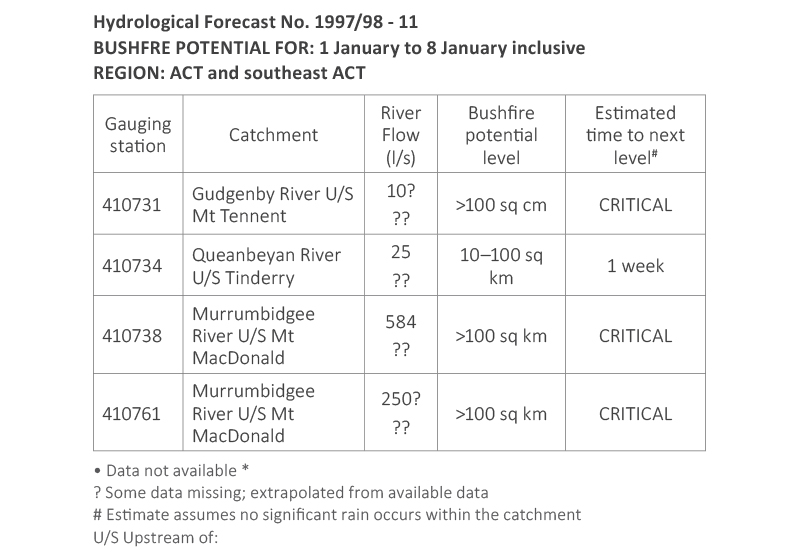
Figure 6a: A sample operational bushfire hydrology forecast issued on 30 December 1997 by Ecowise Environmental for the ACT Bushfire Service.
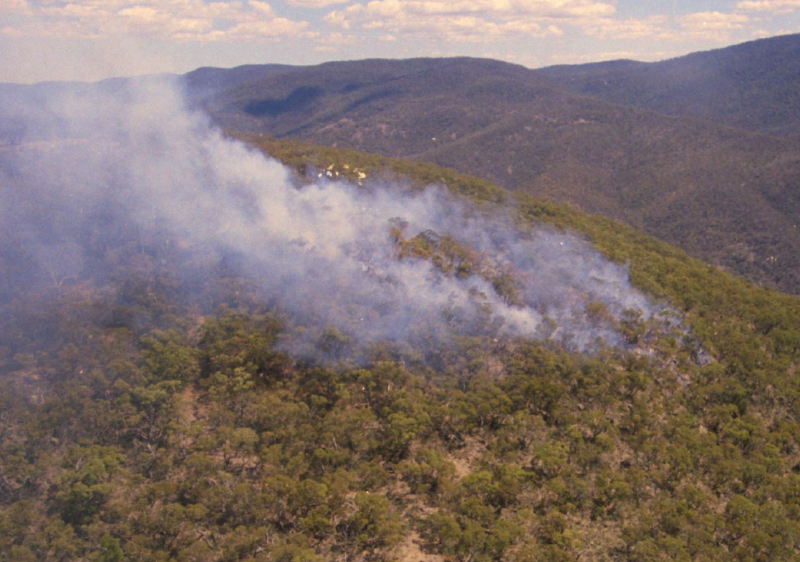
Figure 6b: Subsequent bushfire activity in the hills surrounding Canberra that is rapidly suppressed.
Image: Rick McRae
As a drought progresses, deeper layers of the soil profile dry out. Eventually, it is all dry and rivers stop flowing. At this point, all fire fuels—from fine fuel to logs—are flammable on a day of raised fire danger. This is reflected in a formal operational concept (Figures 6a and 6b) developed by ACT hydrologist, Dr Vitaly Kulik, after the 1983 Gudgenby Fire in southern ACT (Kulik 1990). The HPF Level 2 applies that concept to a set of un-dammed reference rivers across the southeast (see Figure 7). If river drying occurs while a Level 1 alert is in place, a Level 2 alert is issued. A Level 2 alert continues for some time after new river dryings cease (the residual phase) and until their levels consistently climb, thus indicating water flowing from the deep subsoil into the stream. If river drying occurs without a prior Level 1 alert, both Level 1 and 2 alerts are issued.
At this point, the HPF shows that there is sufficient heat and dryness in the seasonal and regional contexts to support extreme bushfire development.
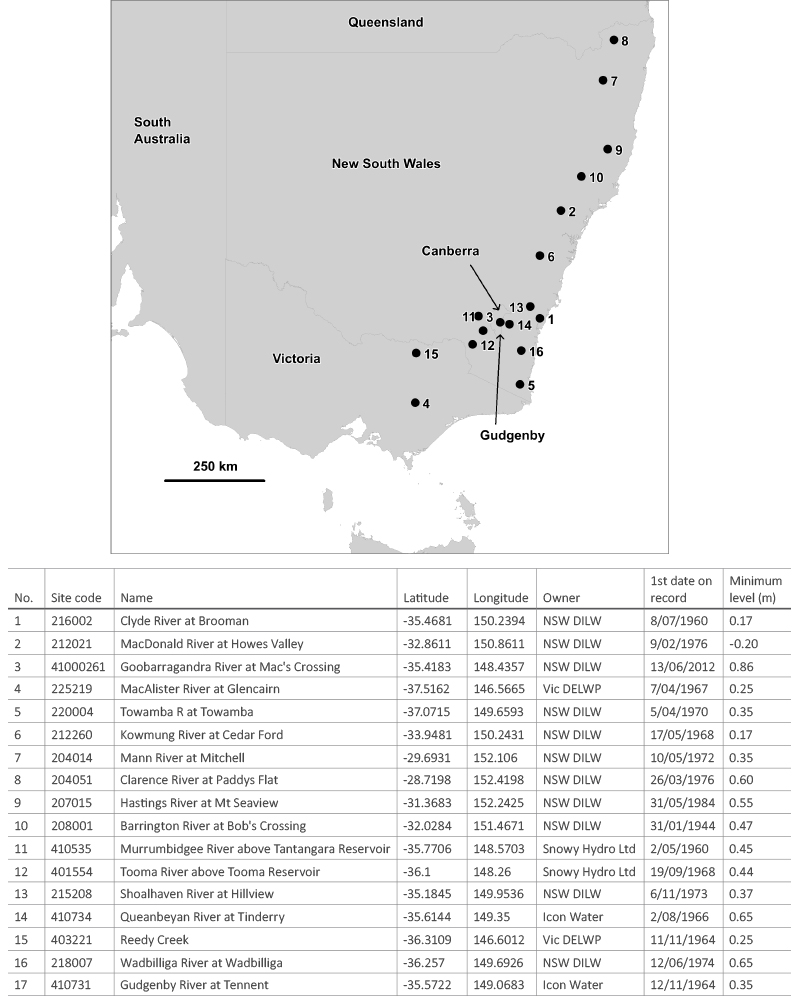
Figure 7: Metadata for the set of usable hydrological stations.
Source: Bureau of Meteorology
Level 3
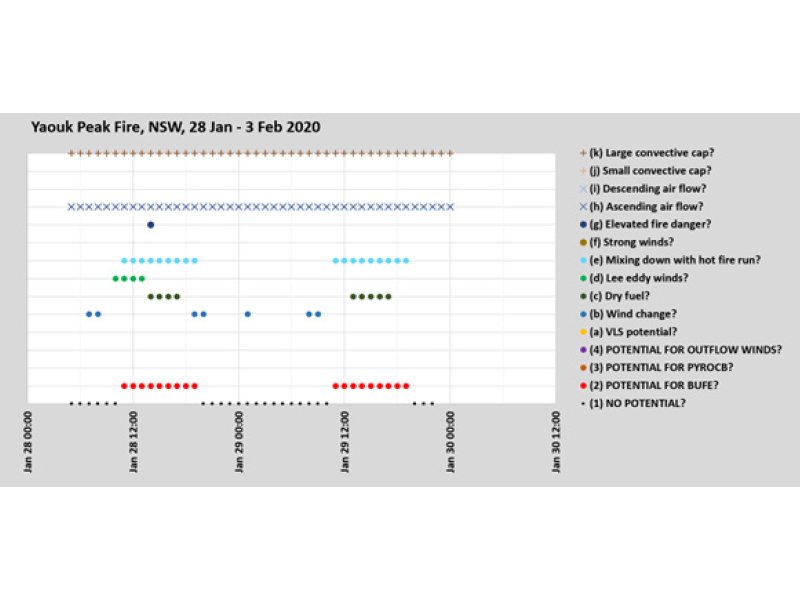
A Level 3 alert is issued when analysis of conditions raise concerns about extreme fire activity. If a Level 2 alert is issued, the next step is for Fire Behaviour Analysts attached to fires to determine if conditions are conducive to a Blow-Up Fire Event (BUFE). A BUFE occurs when a fire forms deep flames and when it stops being a line of fire and becomes an area of fire with a large firefront (see Figure 8). The convection column above this large fire behaves differently, allowing a coupling of the fire with the atmosphere above. This causes a switch from quasi-steady-state fire behaviour (where if you know the terrain, the fuel and weather you usually know what the fire is likely to be doing) to dynamic fire behaviour (where you need to know the terrain, the weather including the stability and the fire itself; fuel loading is not a key element).
Since fires in Canberra in 2003, it has been clear that firefighters are routinely dealing with 2 types of fire. Quasi-steady-state fires have been well predicted by McArthur meters and also the Australian Fire Danger Rating System. Dynamic fires have had limited validated predictive tools available; especially the Continuous - Haines Index (Mills & McCaw 2010) and the Blow-Up Fire Outlook model (McRae & Sharples 2013, 2014).
Extreme bushfires, as defined by Sharples et al. (2016), develop dynamic fire behaviour and form one or more BUFEs. A BUFE requires deep flaming with 7 known causes:
- Strong winds, creating deep flaming zones.
- Wind change, causing a fire flank to form a new, larger fire front.
- Eruptive growth, which requires canyon-like landforms.
- Vorticity-driven Lateral Spread, when fire interacts with eddy winds and spreads in 2 directions at once.
- Dense spotting, reflecting changes in fire intensity as spot fires merge.
- Use of accelerants, in accord with Incident Action Plans, forming certain fire patterns.
- Interior ignition, a problem in the vegetation mosaics of the Boreal Forests.
A common element is low fuel moisture for dead-and-down fuel, which allows easy fire spotting. Damaging BUFE occurrence is not strongly related to fire danger nor to fuel loads, apart from the need for a prior fire with the potential to have high intensity. Some new ignitions or break-aways escalate in this way almost immediately (e.g. Kilmore East fire on Black Saturday 2009 and the Bendora fire breakaway on 18 January 2003, west of Canberra, shown in Figure 8).
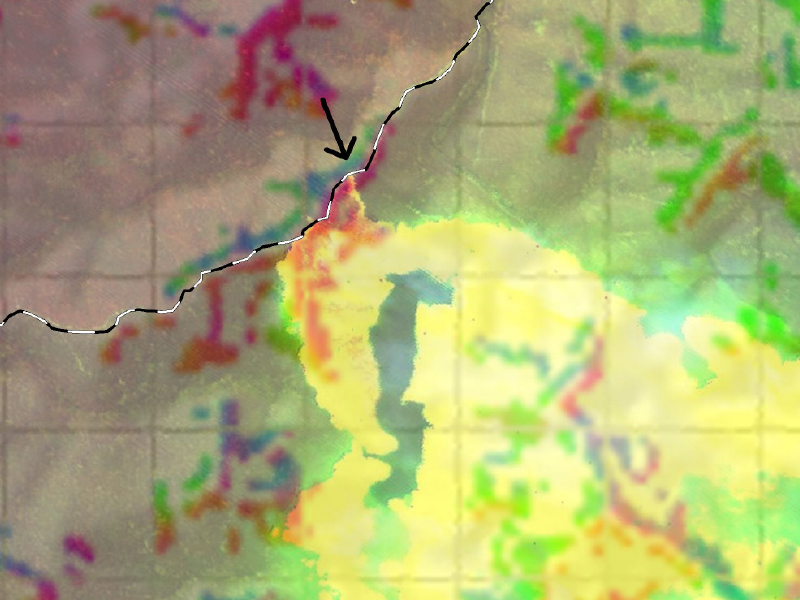
Figure 8: An example of a minor breakaway rapidly causing deep flaming and a Blow-Up Fire Event.
Image: NSW Rural Fire Service
Figure 8 shows a linescan 2 hours after a spotover (shown by the arrow) of a long-held containment line (dashed line) near Bendora Dam in New South Wales on 18 January 2003. Active flaming is shown in yellow and the map grid has one kilometre spacing. Overlaid is a landform model of areas prone to Vorticity-driven Lateral Spread (VLS). The red colour indicates VLS generators under the then-prevailing northwest wind. Note the intense spotting on the southern edge.
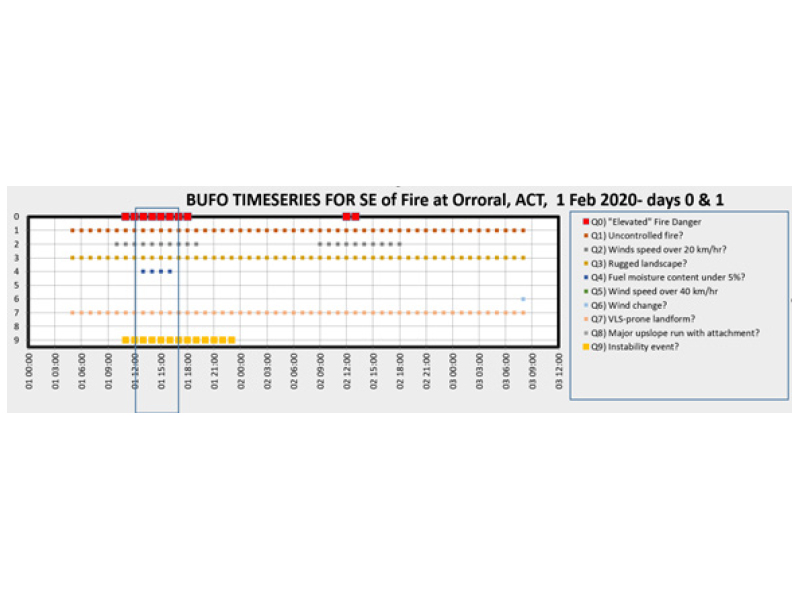
A revised model for BUFE formation, the Blow-Up Fire Outlook 2 (BUFO2) has been developed. This takes inputs on the fire, the terrain, the atmosphere and the surface weather and produces a single-time or time-series outlook for steady-state fire behaviour, a BUFE, a pyroCb or a foehn-effect fire. Inputs can be from forecasts several days in advance and up to the current operational shift time. The model may lead to a Level 3 alert. A trial version of BUFO2 is included on the HPF webpage.
There are many useful sources of data on fires that are relevant. A good example for pyroCb monitoring is the NASA WorldView. Normal Bureau of Meteorology sources are used for weather data and weather balloon data is from the Bureau or from fire agencies. A range of terrain analyses for forested parts of Australia can be found on the HighFireRisk website. The VLS terrain analysis maps are also important.
Level 4
A Level 4 alert is a trigger to take action. As the Level 3 alert is a cue to collect field observation data to create intelligence products that can drive changes to an Incident Action Plan, a resulting Level 4 alert is an unambiguous and formally defined trigger to act. In such times, the baseline objective for incident management teams and fire divisions should be to save lives. BUFEs typically last for around 3 hours and may span an area ranging from 5km by 5km up to 70km by 20km. The summer bushfires in 2019–20 produced at least 170 BUFEs, allowing the first statistical estimates of these sizes to guide Incident Management Team decision-making.
BUFO2 is not a spread model. It is a risk model to assess the likelihood of high-consequence events on the fireground. It is important to note that the aim is not fire-spread prediction. There is no headfire and fire progression is by means of medium-range spotting and lateral spread. There are no opportunities to intervene to halt the fire’s spread. Ground or air observers need to look for the lead-up steps occurring such as a fire heading into terrain that is able to form deep flaming through VLS or eruptive growth, or to confirm the initiation of an event by noting changes in the smoke plume or clouds around it. Most importantly, in the future, it may be possible to use these forecasts and observations to avoid the onset of a BUFE. For example, if an area should not be allowed to burn when fine fuels are fully flammable, then it could be burnt at an earlier, safer time.
The HPF is currently in a draft form and is waiting an operational testing when the next Level 1 alert is issued.