Study area: Wollongong, Australia
Wollongong is a coastal city in the Illawarra region of New South Wales. Situated approximately 80 km south of Sydney (see Figure 1), the city is nested in a narrow coastal plain with the Illawarra Escarpment to the west and the Tasman Sea to the east (Flentje & Chowdhury 2005). The greater Wollongong metropolitan area is approximately 1296 km2 with a population of over 293,575, made up of 50.8 per cent female and 49.2 per cent male (Australian Bureau of Statistics 2016). This makes it the third largest city in New South Wales and the 10th largest in Australia. Within the greater Wollongong metropolitan area, there are 108 suburbs spread across three different local government areas, namely the City of Wollongong, the City of Shellharbour and the Municipality of Kiama.
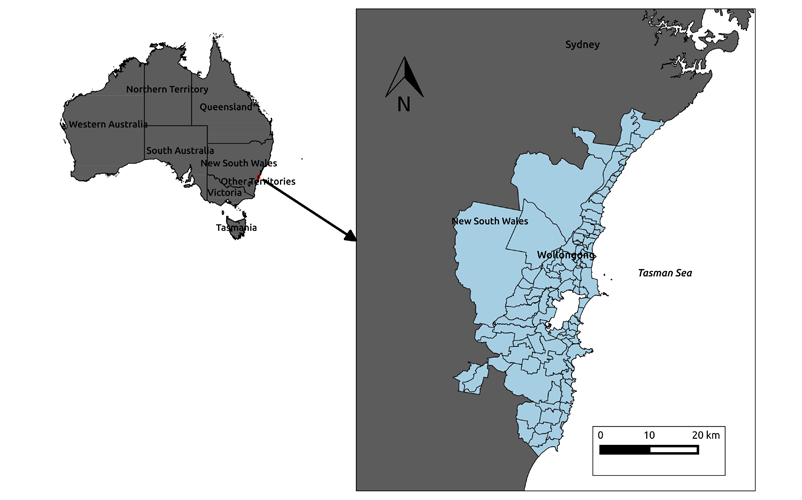
Figure 1: The study area was Wollongong on the southeast coast of Australia.
Wollongong experiences a wide range of natural hazards such as landslides, heatwaves in the summer months, and damaging winds that sometimes exceed 100 km/h, but the biggest natural hazard threats remain flash floods and storms (Flentje & Chowdhury 2005). In the following section, we present the approach employed in order to compare the results of social vulnerability computed for Wollongong suburbs, using both the SSVI technique and the traditional method.
Approach for method comparison
The method comparison for the SSVI technique and the traditional approach of measuring social vulnerability followed a systematic process as depicted in Figure 2. Social vulnerability was computed for the various aspects investigated (i.e. income-specific, CALD-specific, children-specific, elderly-specific, disability-specific and overall). The SSVI technique was used followed by the traditional approach. This computation was done for all 108 suburbs in the greater Wollongong metropolitan area. It was observed that there were some new and sparsely inhabited suburbs with zero value results for the two methods. To ensure that the comparison results were not biased by these suburbs, the records were removed before conducting the comparison test. For disability-specific social vulnerability N=89 (19 zero value records were removed), for elderly-specific social vulnerability N=100 (8 zero value records were removed), for CALD-specific social vulnerability N=68 (40 zero value records were removed), for children-specific social vulnerability N=95 (13 zero value records were removed) and for income-specific social vulnerability N=103 (5 zero value records were removed).
The raw results of the two measurements were normalised by performing a logarithmic transformation (base 10) to obtain uniformly distributed datasets as required for parametric testing. For purposes of comparison, the normalised results from the two measurements were standardised to have scores from 0–1.
Using the standardised scores, the difference between the two measurements were determined, that is, the value from the traditional approach minus the value from the SSVI approach. The difference was examined for uniform distribution using the Shapiro-Wilk normality test (Nahm 2016). If the difference was uniformly distributed, a one-sample T-test was conducted with test value=0. The one-sample T-test is a useful and robust parametric test for a method comparison study (Nahm 2016). The T-test essentially aims to answer one question: Is there a significant difference between the results from the two measurements (i.e. the SSVI approach versus the traditional approach)? To establish this, the T-test determined if there is a variation from zero of the difference between the two measurements across the suburbs investigated.
The null hypothesis was that there was no significant difference between the two measurements. If the difference between the two measurements varied significantly from zero (i.e. statistically significant), then the conclusion is that the two measurements do not agree. However, if the T-test result was not statistically significant, this would indicate some level of agreement between the two methods, in which case, we will proceed to determine the level of agreement using the Bland–Altman plot (Bland & Altman 2007).
However, if the difference between the two measurements was uniformly distributed, the non-parametric equivalent of the one-sample T-test would be used, that is, the Wilcoxon’s signed rank test (Nahm 2016). The null hypothesis was that the median difference between the two measurements equalled zero. If the alternative hypothesis was true and the median difference between the two measurements varied significantly from zero (i.e. statistically significant), then the conclusion is that two measurements do not agree. However, if the test result was not statistically significant, this would indicate some level of agreement between the two methods, in which case, we will proceed to determine the level of agreement using the Bland–Altman plot.
Results
The results of the Shapiro-Wilk normality tests indicated that only the CALD-specific (p=0.242), elderly-specific (p=0.233) and children-specific (p=0.122) aspects of social vulnerability are uniformly distributed with p>0.05. The disability-specific, income-specific and the overall (composite) aspects of social vulnerability had p values of 0.000, 0.003 and 0.000, respectively. Hence, a one-sample T-test, with a test value of zero, was conducted for the CALD-specific, elderly-specific and children-specific aspects of social vulnerability. The results presented a 95 per cent confidence intervals, that is, statistical significance at the p<0.05 level. For the CALD-specific social vulnerability, the results showed that the difference in values measured by the two methods was significantly lower (-0.052±0.135) than zero, t(67)=-3.166, p=0.002. The results for the children-specific social vulnerability showed that the difference in values measured by the two methods was significantly higher (0.268±0.323) than zero, t(94)=11.751, p=0.000. For the elderly-specific social vulnerability, the results showed that the difference in values measured by the two methods is significantly higher (0.247±0.396) than zero, t(99)=16.047, p=0.000. Hence, the null hypothesis was rejected and the conclusion was that the two measurements do not agree for the CALD-specific, elderly-specific and children-specific aspects of social vulnerability.
The non-parametric Wilcoxon’s signed rank test was conducted for the disability-specific, income-specific and the overall (composite) aspects of social vulnerability.
The disability-specific social vulnerability rendered a Z-score of -6.835, which was statistically significant (p=0.000) at 95 per cent confidence level. From the 89 suburbs involved in the test, there were 14 negative ranks that summed to 332 and 75 positive ranks that summed to 3673. A negative rank means the measurement from the traditional method is lower than that from the SSVI approach while a positive rank indicates the opposite. The higher the difference between the sum of ranks for the positive and negative ranks, the greater the difference between the SSVI method and the traditional method.
The income-specific social vulnerability rendered a Z-score of -6.448, which was statistically significant (p=0.000) at 95 per cent confidence level. From the 103 suburbs involved in the test, there were 24 negative ranks that summed to 718 and 79 positive ranks that summed to 4638.
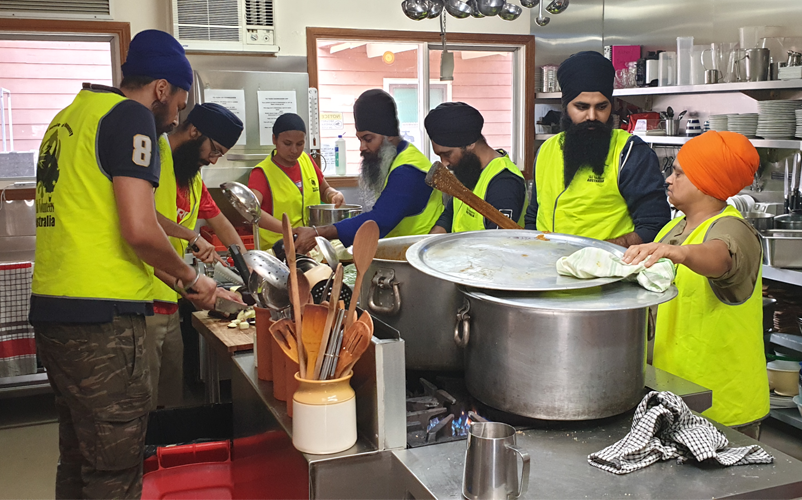
Extensive fires in January 2020 in Victoria’s east exposed many communities and holiday makers to the fire danger as well as loss of amenities and access to food. Members of the Melbourne-based Sikh Volunteers Australia travelled to fire-affected regions providing free meals to hundreds of people. Image: Sikh Volunteers Australia permission granted
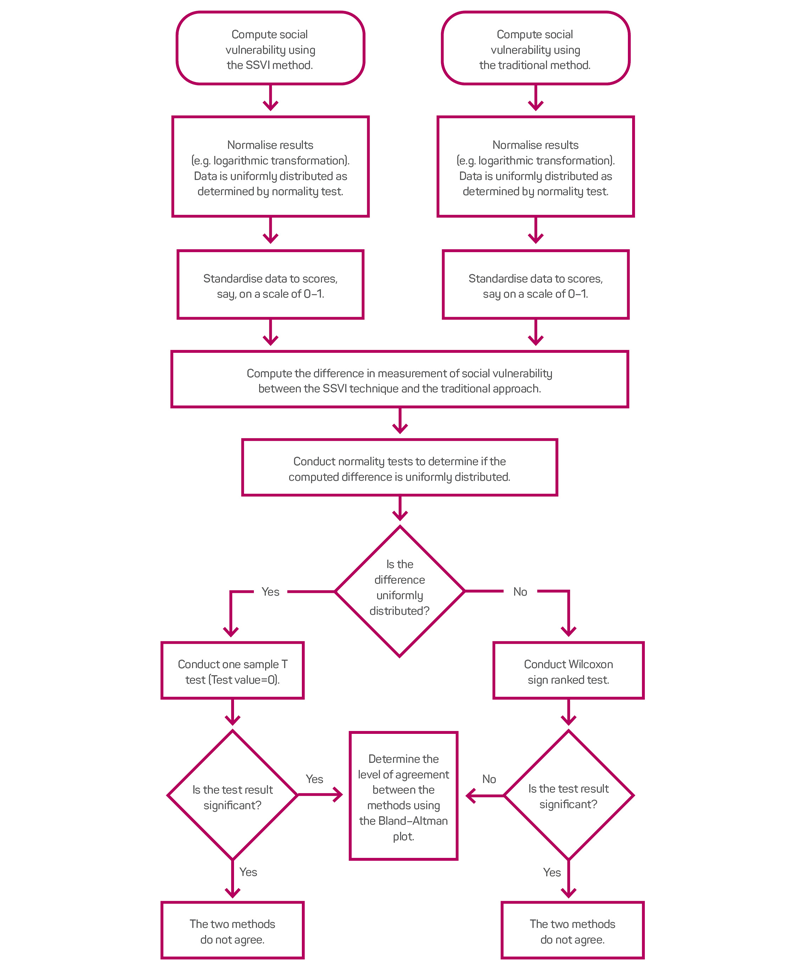
Figure 2: Methodology flow chart used to determine the social vulnerability index.
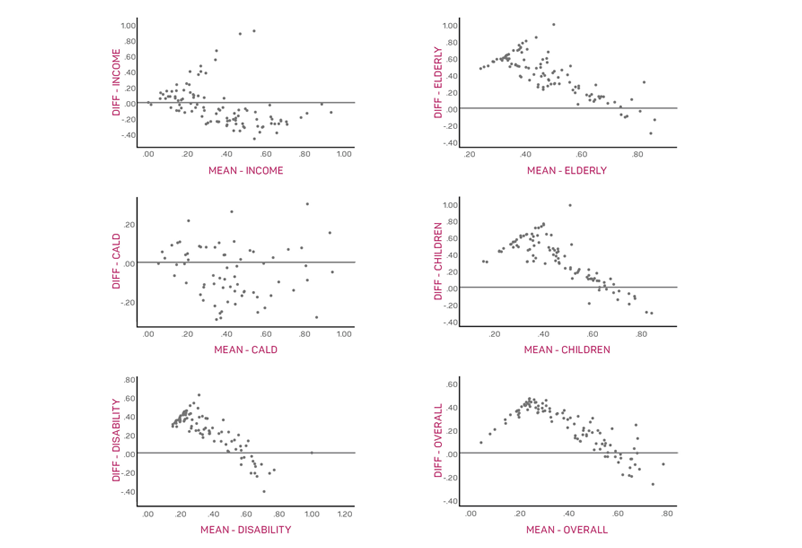
Figure 3: Scatter plots showing variations in the level of agreement between the SSVI and traditional method.
The composite or overall social vulnerability rendered a Z-score of -7.610, which was statistically significant (p=0.000) at 95 per cent confidence level. From the 103 suburbs involved in the test, there were 17 negative ranks that summed to 365 and 86 positive ranks that summed to 4991. Based on these results (i.e. p< 0.05), the null hypothesis was not rejected and the conclusion was that the two measurements do not agree for the disability-specific, income-specific and the overall aspects of social vulnerability.
A scatter plot in Figure 3 shows variations in the level of agreement between the two methods across the range of suburbs investigated, with the difference between the two methods plotted on the y-axis and the mean between the two methods plotted on the x-axis. The further away the points are from the zero line, the lower the level of agreement. In interpreting the social vulnerability scores, it is important to note that:
- 0.0–0.2=Very Low (VL) vulnerability
- 0.2–0.4=Low (L) vulnerability
- 0.4–0.6=Median (M) vulnerability
- 0.6–0.8=High (H) vulnerability
- 0.8–1.0=Very High (VH) vulnerability (Ogie & Pradhan 2019).
Hence, when the level of difference in Figure 3 is greater than 0.2, this would certainly warrant a disagreement in the category of vulnerability (e.g. H versus VH) to which a suburb is assigned. The maps are presented to highlight the difference in the results for only the best case (Figure 4) and the worst case (Figure 5) in terms of method agreement.
Discussion
Overall, the results show there is a significant difference in the outcomes obtained when the SSVI approach is used to compute social vulnerability as compared to when the traditional approach is used. The conclusion is that the two methods do not agree for measuring various aspects of social vulnerability based on the results of several statistical tests, including the one-sample T-test and its non-parametric equivalent- the Wilcoxon’s signed rank test. Figure 4 is the best case of agreement between the two methods, yet it is obvious that the SSVI approach highlights some additional suburbs (e.g. ID=57, 39 and 64) in the ‘Very High’ vulnerability category that are not captured in the same category using the traditional approach. Apparently, Wollongong (57) has the highest (15.34 per cent) representation of people from CALD backgrounds in the entire study area, while Port Kembla (39) and Fairy Meadow (64) have relatively higher numbers of people with limited English language proficiency as compared to their multilingual residents who could potentially help with the interpretation of emergency messages or warnings. The traditional approach could not capture these factors.
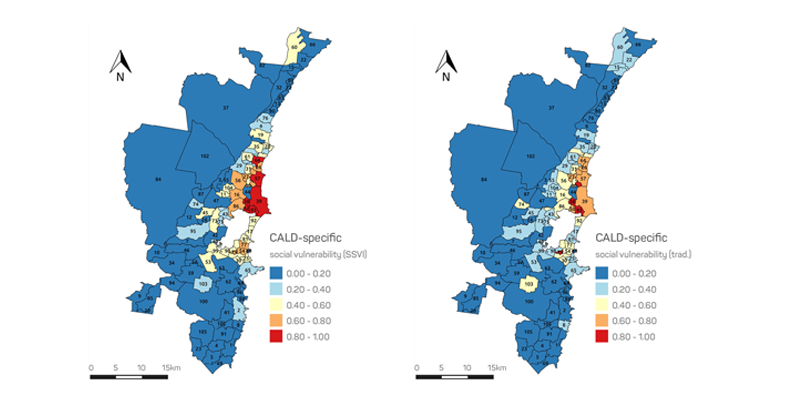
Figure 4: CALD-specific social vulnerability using the SSVI approach (left) versus the traditional approach (right).
In Figure 5, the most striking contrast are in Cataract (37), Carrington Falls (85), Foxground (105) and Clifton (72). The traditional approach classified these four suburbs in the VH vulnerability category because the proportion of their population that is elderly is very high. However, when the population of the elderly across all the other suburbs is considered (as proposed in the SSVI approach), these four suburbs are ranked in the VL vulnerability category. The reason is because only a very small proportion of the elderly population in the entire study area live in these four suburbs. The SSVI method ranked Wollongong (57), Kiama (2), Kanahooka (43), Dapto (73) and Woonona (19) in the VH vulnerability category mainly because these suburbs have the highest elderly population in the study area, yet the propensity for the rest of the population to provide unpaid care to an elderly person is slightly below the average. For the same reason, Albion Park (53) would have been implicated in the VH category except that its elderly population is relatively smaller than the rest of the population that can potentially provide support in times of natural perils.
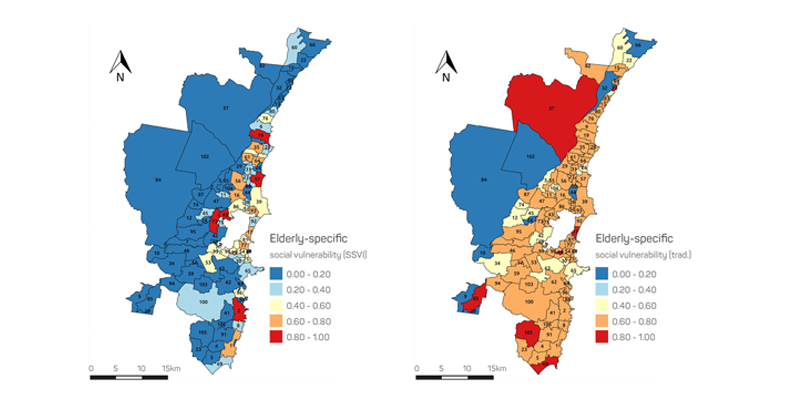
Figure 5: Elderly-specific social vulnerability using the SSVI approach (left) versus the traditional approach (right).
Implications for emergency and disaster management
The SSVI is quite different from the traditional approach of computing social vulnerability. Unlike results from the traditional approach that do not account for the strengths within communities, the SSVI technique facilitates fairer decisions about the most vulnerable communities. This could be prioritised in resource allocation to improve resilience and coping capacity. Practitioners and emergency services organisations can rely on the results from the SSVI technique in order to plan and determine the levels of preparedness, response (e.g. evacuation priority) and recovery effort required in different communities. During major hazard events, citizens, volunteer workers and donors of relief materials can rely on results from the SSVI technique to identify highly vulnerable communities that may require higher levels of specific supplies (e.g. baby food, nappies, mobility aids, etc.). The information related to vulnerability from the SSVI can also be used as an input in computing natural hazard risks (Boon 2013, Buckle 1999).
There are three main advantages to adopting the strength-based approach:
- It encourages authorities to recognise the strengths in communities rather than just the deficiencies or weaknesses.
- It can help to refocus resources that would have been lavished on experts to strengthen capacities within communities.
- It can encourage and empower citizens to take actions to support their communities rather than relying on overstretched resources and expertise from emergency services organisations.
Adopting the strength-based approach means taking the focus away from what is ‘wrong’ to what is ‘strong’ within communities; a position consistent with an emphasis on capacity over vulnerability (Handmer 2003). This helps to build resilient communities, not by virtue of sole reliance on external sources, but by helping communities recognise their inherent strengths and to act together. In other words, by adopting the strength-based approach, communities can potentially avoid ‘secondary vulnerability’, that is, vulnerability arising due to excessive reliance on external sources. This does not suggest that emergency services organisations will become less relevant to communities. Rather, it is highlighting the danger of undermining community resourcefulness due to over-reliance on emergency services organisations.
This can be problematic during major emergencies and disasters where too many communities are affected and the resources within emergency services are overstretched. It is important that, as part of implementing the strength-based approach, an enabling environment is created for community strengths to be harnessed. This requires equipping the able-bodied members of communities with the requisite knowledge and training to work alongside emergency services organisations. In the same vein, emergency service personnel should be trained to work alongside community members and other ‘spontaneous’ volunteers without perceiving them as threats. Emergency services organisations could consciously seek to understand the unique strengths of each community and develop workable plans to harness same during events. The SSVI technique offers ideas for where there might be community resources that could potentially be used to help minimise community vulnerability.
Conclusion
Natural hazards often have disproportionate impacts on different communities due to social inequalities that account for the difference in people’s sensitivity to natural hazards and their ability to respond and recover. Social vulnerability analysis can help to improve understanding of those communities or places, which, are most likely to suffer disastrous outcomes. In the traditional approach to computing social vulnerability, the focus has been on weaknesses (e.g. old age, low income, language barriers, etc.). However, the SSVI aims to account for the strengths and resourcefulness of people within communities to self-organise and minimise the effects of natural hazards. This study compared the two methods through a case study involving social vulnerability measurement for various suburbs in the Wollongong area of New South Wales. The results revealed that there is a significant difference between the values obtained from measurements using the SSVI technique and those generated by the traditional approach. This has implications for emergency management. Future studies can build on the SSVI technique by exploring additional factors or dimensions of social vulnerability, including institutional and cultural barriers. A consideration of hazard-related information and other place-specific factors can help to improve the relevance of the SSVI approach to other cities.