Due to the attractiveness of living in a natural environment, more people are likely to reside in urban-bush interface areas that expose them to dangers from bushfires. Surveys conducted after fires over 2009–2015, indicated that many residents in urban-bush interface areas under-estimate their bushfire risk and do not prepare adequately for these events. For this study, householders living in urban-bush interface areas of Melbourne completed an online survey that showed that the attractiveness of the natural environment setting was the major reason for living in the location. The majority of respondents indicated bushfires as a negative feature of living in the urban-bush- interface. Compared with findings from post-bushfire surveys during 2009–2015, a greater number of respondents had a bushfire survival plan to evacuate as well as being prepared to evacuate if threatened. However, one in eight householders planned to ‘wait and see’ how a fire developed before taking action. Also, levels of activities to reduce house vulnerability to bushfire were low. For some householders, this was because they believed such preparations would be ineffective and, thus, pointless. This unpreparedness presents challenges to emergency management organisations and, in particular, fire agencies.
Introduction
In Australia, many people reside on the edges of cities in areas with high levels of vegetation sufficient to fuel major bushfires. These areas typically have large numbers of houses that abut or intermingle with flammable bushland vegetation (Radeloff et al. 2005). These areas are known variously as wildland-urban interfaces (Radeloff et al. 2005), rural-urban interfaces (Pearce 2019), peri-urban areas (Llausàs et al. 2016) or the urban-bush interface (Solangaarachchi, Griffin & Doherty 2012). Over the last 20 years, several Australian cities have experienced disastrous bushfires in the urban-bush interface, including the Canberra ‘firestorm’ in 2004, the Perth Hills fires of 2011 and 2015, the south-east Tasmania fire in 2013, the Blue Mountains fires of 2013 and the Adelaide Hills fire of 2015. Fires in the urban-bush interface are often more difficult to control than fires burning in areas with fewer houses (Radeloff et al. 2018) and have the potential to lead to very large losses of assets.
Growth in population, demand for housing and desire to live in a natural environment are leading to more people moving into the urban-bush interface, causing an increase in the threat from bushfires (Lohm & Davis 2015, Pearce 2018, Radeloff et al. 2018). While people who live in the urban-bush interface are increasingly exposed to bushfire, they may not adequately perceive the risk to which they are exposed (Every et al. 2015, Langer & Wegner 2018). There is limited research that has directly examined the experiences, beliefs and actions of residents in urban-bush interfaces in relation to bushfire risk. A study by Beringer (2000) reported low levels of bushfire preparations by urban-bush interface residents. Following the 2009 Victorian Black Saturday bushfires, surveys were commissioned and included urban-bush interface residents. Between 2009 and 2015, the Bushfire CRC and Bushfire and Natural Hazards CRC conducted nine post-bushfire surveys of householders threatened by serious bushfire events (see Table 1). Respondents included 1362 urban-bush interface residents. Survey findings indicated that prior to the bushfires, significant percentages of residents did not believe they were at risk and had no plan for what to do in the event of a bushfire. In addition, the surveys found that household bushfire safety planning and preparation levels for evacuation, house protection and property defence were lower than what fire agencies regarded as desirable (McLennan, Paton & Wright 2015). This finding is consistent with a longitudinal study of a sample of Victorian households in areas deemed to be at notably high risk of bushfire, most in urban-bush interface locations (Muir et al. 2017).
Lohm and Davis (2015) reported fewer negative findings from interviews (n = 11) with householders in at-risk locations on Melbourne’s urban fringe. Using a qualitative methodology, they concluded that residents had a strong emotional attachment to their property but were aware of the danger posed by bushfires and the likely limited effectiveness of preparations to protect their property. Lohm and Davis (2015) proposed the centrality of an ongoing existential dualism for the residents: a precarious balance of living in an environment that was both healthy and dangerous. The study suggested that bushland-dwelling residents engaged in a form of emotionally based risk management in which possible future danger from bushfire was counterpoised by love of the surrounding natural environment.
Table 1: Threatened householders in urban-bush interface locations reporting no pre-fire concern and pre-fire plans.
| Location, date; (number of interviews/online survey responses)a, type of location | No pre-fire concern | No pre-fire plan | Planned to leave | Planned to stay and defend | Planned to wait and see |
| 1. Eight fire complexes, Victoria; February 2009; (126)b, IM, IF | 25 | 33 | 25 | 33 | 3 |
| 2. Clifton Hill, WA; January 2011 (40)c, IM | 7 | 20 | 65 | 10 | 5 |
| 3. Perth Hills, WA; February 2011 (456)c, IM, IF | nr | 24 | 28 | 20 | 28 |
| 4. South-eastern Tasmania; January 2013 (245)c, IM, IF | 8 | 12 | 47 | 26 | 15 |
| 5. Shoalhaven, NSW; January 2013 (80)d, IM, IF | 16 | 28 | nr | nr | nr |
| 6. Blue Mountains, NSW; October 2013 (79)e, IF | 27 | 17 | 23 | 42 | 18 |
| 7. Port Stevens, NSW; October 2013 (52)e, IM | 44 | 52 | 8 | 25 | 15 |
| 8. Parkerville, WA; January 2014 (91)c, IM, IF | 9 | 19 | 49 | 25 | 7 |
| 9. Sampson Flat, South Australia; January 2015 (193)f, IM | 15 | 17 | 18 | 37 | 18 |
| Unweighted average | 22 | 25 | 33 | 28 | 14 |
Note: IM = housing bushland intermix, IF = housing bushland interface, nr = not reported.
a No.1–No.8 were interviews, No.9 was an online survey, b McLennan, Elliot and Omodei (2011), c McLennan, Paton and Wright (2015), d Mackie and colleagues (2013), e McLennan, Wright and Birch (2013), f Every and colleagues (2015).
Anton and Lawrence (2016) found that while emotional place-attachment to home was related to bushfire mitigation and preparation in rural communities, this was not so in urban-bush interface communities. A study by Strahan, Whittaker and Handmer (2018) surveyed 457 mostly urban-bush interface residents in two areas that had experienced recent bushfire threats. On the basis of a cluster analysis of the information provided by the residents, seven groups or archetypes, of residents were identified. The seven archetypes were related to their stance on evacuating or remaining at their property under imminent bushfire threat:
- responsibility-denying evacuator
- dependent evacuator
- considered evacuator
- community-guided evacuator
- worried waverer
- threat-denying remainer
- experienced and independent defender.
That study concluded that the differences among the archetypes meant that fire agencies needed to adopt a range of approaches to promote bushfire safety. This would accommodate the different motivations and expectations of the different archetypal groups.
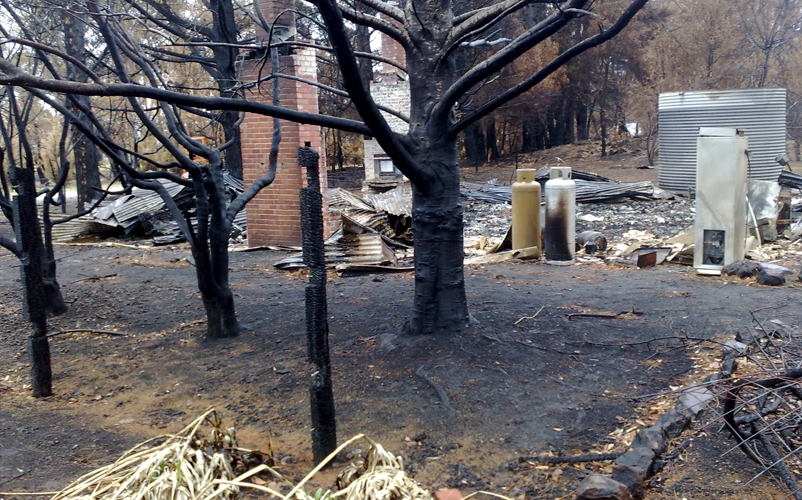
Community research after the 2009 Black Saturday fires showed that the lack of bushfire preparedness of people living in the urban-bush interface presents a challenge for fire agencies.
Image: Jim McLennan
In summary, appreciable percentages of people in the urban-bush interface sampled in the 2009–2015 post-bushfire surveys commissioned by fire agencies seriously misjudged their level of risk, had not planned what to do in the event of a bushfire threat and were not well-prepared to survive. The study by Strahan, Whittaker and Handmer (2018) suggested important differences among urban-bush interface householders in their beliefs about bushfire danger circumstances and appropriate survival options. However, what seems lacking is a broader understanding of the reasons householders reside in urban-bush interface locations, their associated everyday life issues, their perceptions of the threat posed by future bushfires and how these perceptions relate to bushfire safety preparations. Lohm and Davis (2015) go some way towards addressing these issues. However, the study involved a very small number of urban-bush interface residents and the method of recruitment (posters in public places and social networking inviting residents to contact the researchers to discuss bushfire risk and preparations) may have resulted in an unrepresentative group of interviewees who were especially concerned about bushfires.
The present study used an online survey to examine the experiences of a sample of urban-bush interface householders on the fringes of Melbourne. The study included reasons for choosing to live in the location, positive and negative aspects of living in an urban-bush interface area, perceptions of bushfire threat and plans and preparations for such an event. The aim was to understand how residents in the urban-bush interface view bushfire threat to their properties in the context of their living choices and experiences as well as how they plan and prepare for the possible threat.
The research was conducted as part of a larger study investigating how bushfire safety preparations relate to people’s bushfire risk perceptions and everyday life activities. The major finding was that levels of householder bushfire safety preparation actions were linked more to their bushfire-related household priorities than to their perceptions of bushfire risk (Koksal et al. 2019).
Method
Participants
A total of 127 householders completed a survey using the Qualtrics1 online survey software platform. Respondents comprised slightly more women (n = 69, 54 per cent) than men (n = 58, 46 per cent). The median age was 58 years (M = 56.1, SD = 13.19, range = 21–84). Most (n = 121, 95 per cent) were property owners, not renters, and the median period of residency on the property was 10 years (M = 15, SD = 12.63, range = 1–50).
Survey questionnaire
The online survey was developed using information gained from interviews with 32 urban-bush interface householders about their experiences of near-bushland living (Koksal et al. 2019). The survey gathered information about eight aspects of living in the location.
Procedure
The research was approved by the La Trobe University Human Ethics Committee (Reference S17–17). In 2017, 4000 invitations were mailed to residences in six postal areas selected because of their extensive areas of bushland. The postal areas were in three local government areas on the northern fringes of Greater Melbourne being Macedon, Yarra Ranges and Nillumbik. Householders who resided in or within 100 metres of bushland were invited to participate in a study of their experiences of living in their location. The survey introduction defined bushland to include forest, grassland, scrub, parkland, farmland and state or national parks. Eligible householders accessed and completed the survey online. Householders provided the address of their property with the assurance that the information would be deleted once the distance of their home from bushland had been checked using Google Maps satellite imagery.
Results
Close to half (52 per cent) of the 127 respondents were employed and one-third (34 per cent) were retired. The majority (62 per cent) resided on properties larger in size (>0.1 hectares) than a typical urban residential block (Table 2). Most participants (89 per cent) reported they had adequate house and contents insurance against loss due to bushfire.
Table 3 summarises householder reasons for living in the bushland location, and the positive and negative aspects of living in that location. Preference for a natural environment location and the associated lifestyle were the most frequently reported reasons for choosing to live in the location. These were also the most frequently reported positive aspects of bushland living, followed by the sense of community. Concern about bushfire, as a negative aspect of the location, was reported by almost three-quarters (n = 94, 74 per cent) of respondents. While this was the most frequently reported single negative aspect of living in the location (28 per cent), other negative aspects related to daily living such as high property maintenance, lack of services and transport, power outages and poor telecommunications were also mentioned, accounting in total for 67 per cent of the negative aspects of bushland living.
In response to the question about how concerned they were about bushfires when considering whether to live in the location, 24 per cent were not at all concerned, 39 per cent were a little concerned, 31 per cent were moderately concerned and 6 per cent were very or extremely concerned. Almost half the householders (n = 60, 47 per cent) reported awareness of a bushfire threat warning sometime during the previous 10 years. Of these 60 householders, 46 (77 per cent) also reported bushfires as a negative aspect of living in the location. There had been significant bushfire threats to all three local government areas over the past 30 years. Homes had been destroyed and lives had been lost in parts of the Macedon area in the ‘Ash Wednesday’ fires of January 1983. Homes had been destroyed and lives had been lost in more northerly suburbs of Yarra Ranges and Nillumbik local government areas during the February 2009 ‘Black Saturday’ bushfires (these suburbs were not sampled for the study). However, there was no relationship between a householder’s awareness of a previous bushfire threat and nominating bushfire as a negative aspect of living in the location: χ2(1, N = 127) = 0.13, p>0.70.
Table 2: Householder occupations and property types (N = 127).
| Occupation | Per cent |
| Employed full-time | 28 |
| Employed part-time | 24 |
| Retired | 34 |
| Home duties | 6 |
| Full-time student | 6 |
| Unemployed, seeking work | 2 |
| Property type | |
| Normal-sized residential (~0.1 hectares) | 27 |
| Larger-sized residential (>0.1 hectares) | 31 |
| Large ‘lifestyle’ propertya | 31 |
| Agribusiness (farm, winery, nursery, orchard, horse stable) | 11 |
a Usually 1–10 hectares in size, in a peri-urban location, used primarily as a residence because of its natural environment amenity rather than as an agribusiness.
Responses to the question about how likely respondents believed that their property would be threatened by a bushfire in the next five years were:
- extremely unlikely, 1 per cent
- highly unlikely, 4 per cent
- somewhat unlikely, 14 per cent
- somewhat likely, 32 per cent
- highly likely, 25 per cent
- extremely likely, 11 per cent
- almost certain, 13 per cent.