Abstract
Engaging communities proactively in preparedness and response is key to building a cohesive and resilient community. In Australia, responsibility for community engagement often falls to local government. While community-level engagement in emergency and disaster management is necessary, two demographic groups: low socio-economic; and culturally and linguistically diverse populations (hereafter referred to as vulnerable population groups) are of particular interest from an emergency and disaster management planning perspective as they are often exposed to, and are least prepared for, emergency and disaster events. This is due to factors including a lack of housing affordability, low literacy levels and diversity in cultural backgrounds. A community survey was conducted in Logan, a city south of Brisbane, to better understand the challenges of engaging vulnerable population groups in preparedness and response. The survey identified a trend of passivity towards preparedness. It also found that information from traditional mass media and family members was preferred and trusted. Based on these findings, a two-pronged approach is recommended that combines the use of traditional mass media and digital media with proactive face-to-face engagement to improve outcomes.
Introduction
In Australia, there is a government-sanctioned mandate to proactively engage communities in decision-making on issues that may affect them directly. Community engagement is ‘the process of stakeholders working together to build resilience through collaborative action, shared capacity building and development of strong relationships built on mutual trust and respect’ (Australian Institute for Disaster Resilience 2013). In the case of emergency and disaster management, the need for community engagement is central to promoting a sense of collective responsibility and the recognition that everyone benefits when contributing to a safer environment. It also means individuals and communities can exercise choice and take actions to safeguard themselves, their families, neighbours and other stakeholders in the event of an emergency (Hansen et al. 2013)
For government agencies involved in emergency management planning, community engagement is a critical process to identify how the local community understands and interprets disaster-related information. Vihalemm and colleagues (2012) show that community perceptions and concerns in relation to disaster risk often contrast widely from that of experts and government bodies that use scientific methods to analyse disaster consequences and outcomes. People often rely on visual evidence, narratives and personal experience when deciding what to do in emergencies (Vihalemm et al. 2012). By engaging communities in emergency management planning, government agencies and non-governmental organisations (NGOs) can establish effective and trusted ways to disseminate information, strengthen government-community partnerships and break down sociocultural barriers that may hinder disaster risk reduction and management processes.
Defining vulnerable populations
Disasters impact on people regardless of their background, ethnicity, age and demographic characteristics. The weight of impact can be ‘profoundly discriminatory’, with vulnerable populations the most adversely affected (Donner & Rodríguez 2016). The World Health Organization (2017) suggests an umbrella definition of vulnerability that refers to ‘the degree to which a population, individual or organisation is unable to anticipate, cope with, resist and recover from the impacts of disasters’. Similarly, in Australia vulnerability is defined as a ‘situation of individuals, households or communities who are exposed to potential harm from one or more risks. It also refers to the inability of these people or groups to anticipate, withstand, and recover from the damage resulting from an adverse shock’ (Morrone et al. 2011, DCCSDS 2016).
Vulnerable populations are of interest for disaster management planning as they are often the least prepared for such events.
This study identified three challenges to engaging vulnerable populations for effective preparedness and response activities:
- A lack of disaster preparation is a consistent trend across vulnerable populations that often have limited resources and a reluctance to invest in disaster preparedness activities that are often deemed a low financial priority (Lindell & Perry 2003). People in lowincome groups are often in financial survival mode and are more focused on spending to support day-today living rather than prepare for the future. Beckjord and colleagues (2008) reported cases where lowincome people, when provided with pre-packed meals to use in the event of an emergency, often consumed those meals ahead of time because they could not afford to feed themselves on a regular basis. Similarly, due to limited resources, vulnerable groups are less likely to respond to emergency messages even if they receive them. For example, individuals may not evacuate because they lack transportation options or may require special assistance that they feel is unlikely to be met if they evacuate (Rowel et al. 2012).
- Difficulty in reaching vulnerable population groups experiencing isolation due to social, cultural, linguistic and economic factors. People from vulnerable population groups often have weak or limited social networks or connections to the wider community beyond family or cultural groups. This is particularly the case for those with limited or poor English (Beckjord et al. 2008).
- Vulnerable population groups often lack trust in the disaster response community due to negative past experiences or inability to communicate (language or cultural barriers). As a result, vulnerable individuals tend to be reluctant to add their names to vulnerable population registries, to seek preparedness information or to ask for emergency assistance (Palttala et al. 2012)
The aim of this research was to better understand the needs of vulnerable population groups in the case study context to engage the local community more effectively in preparedness and response, contributing to a more cohesive and resilient community.
Case study
Logan City is a local government area of 957 km2 in south-east Queensland, with Brisbane to the north and the Gold Coast to the south. It is the sixth largest local government area in Australia by population with 308,000 residents. While geographically small, the city has 68 suburbs, covering both urban and rural areas and exhibits significant socio-economic and cultural diversity (Logan City Council 2017). Logan City experiences a range of natural hazards. This study took an ‘all hazards’ approach while recognising that the two most common hazard types are bushfires and floods. Figure 1 shows an overlay of areas exposed to floods and bushfires. Overall, 12 per cent of Logan is rated as vulnerable to both hazards.
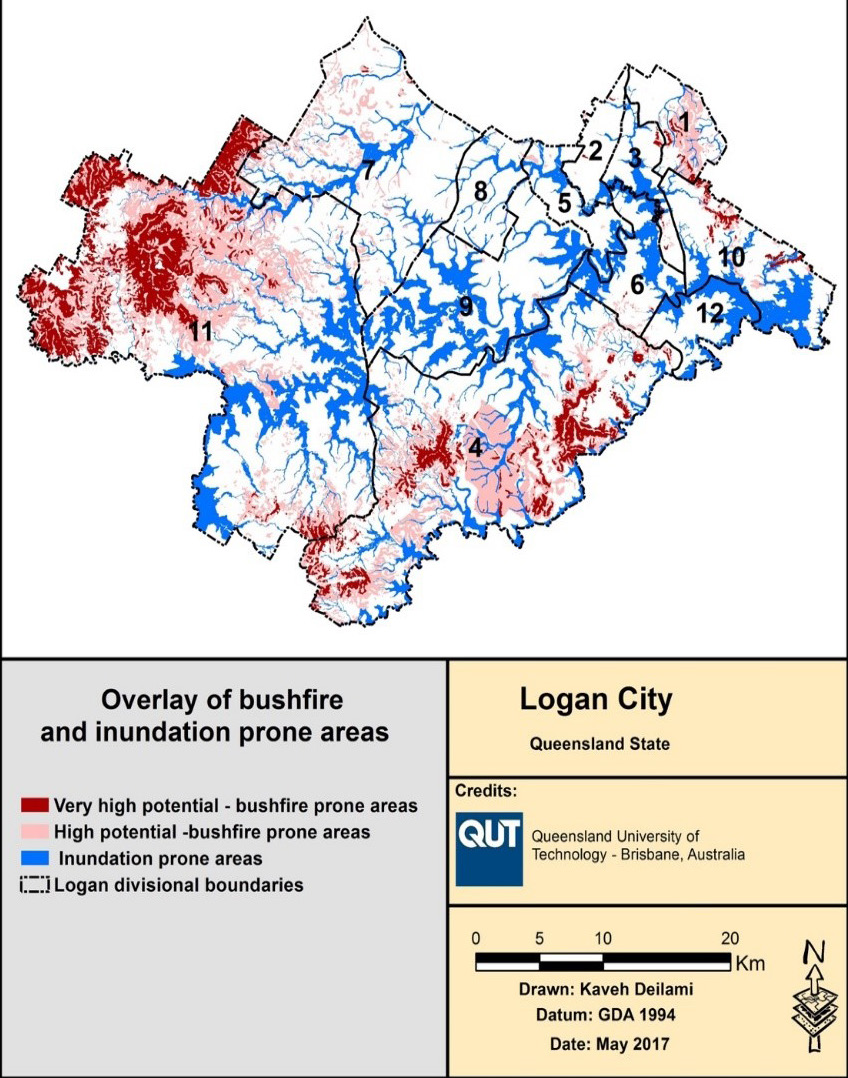
Figure 1: Overlay between bushfire and inundation prone areas for the Logan City.
Low socio-economic population
The Socio-Economic Indexes for Areas1 (SEIFA) is an Australian Bureau of Statistics tool used to rank areas in Australia according to relative socio-economic status. Table 1 shows the value of the SEIFA for local government areas in Queensland with the SEIFA index for Logan being lower compared to other areas in the state.
The index of relative socio-economic disadvantage for Logan rose from 962 in 2006 to 971 in 2011, indicating that the situation is improving but remains lower than many Australian local government areas (2016 data were unavailable at the time the fieldwork was undertaken). Table 2 presents a comparison of low socio-economic populations across Queensland local government areas. This table shows that Logan has a comparable low socioeconomic population to other Queensland areas.
Table 1: SEIFA index of various local governments areas in Queensland (Logan City Council 2017).
|
Local government area |
SEIFA |
|
Logan City |
971 |
|
Greater Brisbane |
1018 |
|
Moreton Bay |
1000 |
|
Ipswich City |
966 |
|
Gold Coast City |
1014 |
|
South-East Queensland |
1016 |
|
Queensland |
1001 |
Table 2: The percentage of low socio-economic people in local government areas of Queensland (Logan City Council 2017).
|
Local government area |
Number |
Total households |
Percentage (%) |
|
Logan City |
15,441 |
97,641 |
15.8 |
|
Greater Brisbane |
123,256 |
796,339 |
15.5 |
|
Moreton Bay |
24,717 |
148,963 |
16.6 |
|
Ipswich City |
9,999 |
63,978 |
15.6 |
|
Gold Coast City |
34,521 |
202,702 |
17.0 |
|
South-East Queensland |
184,825 |
1,143,107 |
16.2 |
|
Queensland |
298,359 |
1,699,819 |
17.6 |
Cultural and linguistic diversity
Logan City has a multicultural population with at least a quarter of its residents born overseas and 215 different nationality and ethnic groups. As shown in Table 3, Logan is comparable to other Queensland local government areas in terms of percentage of residents born overseas (27.3 per cent). In Logan City, the top three languages spoken at home other than English are Samoan, Mandarin and Hindi.
Tables 1, 2 and 3 show that Queensland local government areas, including Logan, have sizeable vulnerable population groups. This research, while focused on Logan City, has broader application and the lessons learnt in emergency and disaster management can be transferred to other local government areas.
Table 3: Percentage of residents born overseas.
|
Local government area |
Total overseas born |
Total persons |
Proportion of persons born overseas (%) |
|
Logan City |
15,441 |
97,641 |
15.8 |
|
Greater Brisbane |
123,256 |
796,339 |
15.5 |
|
Moreton Bay |
24,717 |
148,963 |
16.6 |
|
Ipswich City |
9,999 |
63,978 |
15.6 |
|
Gold Coast City |
34,521 |
202,702 |
17.0 |
|
South-East Queensland |
184,825 |
1,143,107 |
16.2 |
|
Queensland |
298,359 |
1,699,819 |
17.6 |
Methodology
A survey was conducted in May 2017 to assess levels of community preparedness and to understand how and where vulnerable population groups are obtaining disaster-related information. The survey targeted Logan residents over 18 years of age and was conducted face-to-face in community locations where the target population groups are known to frequent. These included takeaway diners, shopping centres, libraries and places of worship. The survey was conducted in English and translated into other languages to facilitate participation by target population groups. Potential survey respondents were approached at community locations and were invited to participate in the survey, which they could complete on the spot. Coincidentally, this data collection took place two months after flooding caused by Tropical Cyclone Debbie in March and April 2017. Participants were encouraged to answer the survey questions based on their experiences of the cyclone, where applicable. The survey data was analysed using IBM SPSS statistic in three ways: frequency analysis, cross-tabulation and Chi-Square test of independence.
Overall profile of survey respondents
A total of 263 respondents completed the survey. After excluding for missing data, a total of 249 surveys were analysed. Table 4 provides an overview of the characteristics of survey respondents. Survey participants represent a diversity of ethnic backgrounds (see Table 5), which were categorised using Australian Standard Classification of Cultural and Ethnic Groups.
Ethnic background and household income
Participant household income was analysed based on ethnicity. Table 6 shows 53.9 per cent of respondents had a household income greater than $600 per week (i.e. non-low socio-economic population). Based on the survey, the average number of family members living in Logan City was 2.04, which is close to the 2011 average household size of 2.89 for the entire of Logan (Logan City Council Social Atlas 2017).
Crosstab analysis revealed that in five ethnic groups the number of people who earned above $600 per week was higher than those who earned less than $600 per week. These five ethnic groups are: Central Asian (60.7 per cent), North-West European (52.4 per cent), Oceania (56 per cent), People of the Americas (100 per cent) and Sub-Saharan African (62.9 per cent). The majority of people from South-East Asian (72.7 per cent), North African and Middle Eastern (57.1 per cent) groups had household income below $600 per week (i.e. low socio-economic population). Approximately half of those surveyed (46.1 per cent) fell into vulnerable population groups.
Table 4: Characteristics profile of survey respondents.
|
Characteristics |
Frequency (N) |
Percentage (%) |
|
|
Gender |
Male Female |
110 137 |
44.53 55.47 |
|
Age Band |
18 to 24 25 to 34 35 to 44 45 to 54 55 to 64 Over 65 |
47 47 49 37 27 41 |
19.00 19.00 19.80 14.90 10.90 16.50 |
|
Household income |
Below $600/week Above $600/week |
102 122 |
45.54 54.46 |
|
Duration of living in Logan |
Under 2 3 to 5 years Over 6 years |
52 42 151 |
21.22 17.14 61.63 |
|
Number of family members |
1 person 2 to 5 6 and more None |
33 172 42 52 |
13.36 69.64 17.00 21.31 |
|
Internet connection at home |
Yes Sometimes |
183 9 |
75.00 3.69 |
Top five sources of information
Among culturally and linguistically diverse (CALD) population groups, television was ranked as the most common source of information during an emergency or disaster. Receiving phone calls and text messages on mobile phones from family members was the preferred first choice for people of North African and Middle Eastern backgrounds (77.8 per cent), as shown in Table 7. The findings also show that people with Sub-Saharan African, North African and Middle Eastern ethnicities were less likely to use the Bureau of Meteorology (BOM) website as a source of information compared to other ethnic groups. People with South-East Asian, Sub-Saharan African, Southern and Eastern European backgrounds were less likely to use the radio than other groups, which may be attributed to language barriers.
A Chi-Square test of independence was carried out to examine the relationship between ethnic background and the top five information sources. Table 8 shows a partial significant relationship between ethnicity and the BOM website while other important sources of information are in the equation (X2 (8, N=249) =14.332, p=0.074).
Table 9 shows that television ranked first as the main source of information for low socio-economic groups while FM radio ranked fifth as the main source of information.
A partial significant interaction was found (X2 (1, N=249) =3.404, p=0.065) between respondents’ household incomes and use of the BOM website. Participants with household income above $600/week (50 per cent) reported using the BOM website more than people with household income below $600/week (37.6 per cent) (see Table 10).
Table 5: Ethnic background represented by survey respondents.
|
Ethnic subgroup |
Frequency (N) |
Percentage (%) |
|
|
Oceania
|
Australian Peoples |
71 |
29.30 |
|
New Zealand Peoples |
19 |
7.90 |
|
|
Melanesian and Papuan |
1 |
0.40 |
|
|
Polynesian |
38 |
15.70 |
|
|
Total |
129 |
53.30 |
|
|
Central Asian
|
Central Asian |
4 |
1.70 |
|
Southern Asian |
29 |
12.00 |
|
|
Total |
33 |
13.70 |
|
|
North African and Middle Eastern
|
Arab |
6 |
2.50 |
|
Other North African and |
2 |
0.80 |
|
|
Middle Eastern People of the Sudan |
1 |
0.40 |
|
|
Total |
9 |
3.70 |
|
|
North-East Asian
|
Chinese Asian |
13 |
5.40 |
|
Other North East Asian |
5 |
2.10 |
|
|
Total |
18 |
7.50 |
|
|
North-West European
|
British |
9 |
3.72 |
|
Northern European |
2 |
0.83 |
|
|
West European |
44 |
4.55 |
|
|
Total |
22 |
9.10 |
|
|
People of the Americas
|
Central American |
1 |
0.40 |
|
South American |
1 |
0.40 |
|
|
Total |
2 |
0.80 |
|
|
South-East Asian
|
Mainland South-East Asian |
9 |
3.70 |
|
Maritime South-East Asian |
3 |
1.20 |
|
|
Total |
12 |
4.90 |
|
|
Southern and Eastern European
|
Eastern European |
1 |
0.40 |
|
South-Eastern European |
3 |
1.20 |
|
|
Southern European |
5 |
2.10 |
|
|
Total |
9 |
3.70 |
|
|
Sub-Saharan African
|
Sub-Saharan African |
5 |
2.10 |
|
Central and West African Southern |
1 |
0.40 |
|
|
and East African |
2 |
0.80 |
|
|
Total |
8 |
3.30 |
|
Degree of comfort in asking for help in the event of a disaster
CALD population groups as a whole felt most comfortable asking family members for help in an emergency (see Table 11). This was followed by friends, which was cited by all ethnic groups except Central Asians and people from Sub-Saharan African. Police and Queensland Fire and Emergency Services were highly cited by all except North African, Middle Eastern and People of the Americas. Neighbours were highly cited by Central Asians, People of the Americas and South-East Asians.
A significant relationship was found between ethnic background and the level of comfort to ask for help from neighbours X2 (16, N=249) = 27.074, p<0.05 (see Table 12). People of the Americas (100 per cent) and Central Asian (82.1 per cent) ethnicities were more likely to ask for help from neighbours. Sub-Saharan African (25 per cent) were less willing to ask for help from their neighbours.
The results were similar for low socio-economic groups (see Table 13) who indicated they were most comfortable asking family members for help, followed by Police and Queensland Fire and Emergency Services, and then friends. The results suggest that an individual’s household income did not affect the degree of comfort to ask for help in an emergency.
From the Chi-Square test of independence (see Table 14) a partial significant relationship was found between respondents’ household incomes and levels of comfort in asking for help from friends (X2 (2, N=249) = 5.636, p=0). People with household incomes below $600/ week (70.2 per cent) were less likely to ask for help from their friends than respondents with higher reported income above $600/week (82.9 per cent).
Table 6: Comparison of household income and ethnicity.
|
Ethnic background |
Household income number (%) |
Total |
|
|
Below $600/week |
Above $600/week |
||
|
Central Asian |
11 (39.3) |
17 (60.7) |
28 (100.0) |
|
North African and Middle Eastern |
4 (57.1) |
3 (42.9) |
7 (100.0) |
|
North-East Asian |
10 (55.6) |
8 (44.4) |
18 (100.0) |
|
North-West European |
10 (47.6) |
11 (52.4) |
21 (100.0) |
|
Oceania |
51 (44.0) |
65 (56.0) |
116 (100.0) |
|
People of the Americas |
0 (0.0) |
2 (100.0) |
2 (100.0) |
|
South-East Asian |
8 (72.7) |
3 (27.3) |
11 (100.0) |
|
Southern and Eastern European |
4 (50.0) |
4 (50.0) |
8 (100.0) |
|
Sub-Saharan African |
3 (37.5) |
5 (62.5) |
8 (100.0) |
|
Total |
101 (46.1) |
118 (53.9) |
219 (100.0) |
Table 7: Top five sources of information for CALD population groups.
|
Ethnic background |
BOM |
Family members via mobile phone |
Friends via mobile phone |
Television |
FM radio channel |
|
count (percentage %) |
|||||
|
Central Asian |
17 (53.1) |
16 (50.0) |
14 (43.8) |
25 (78.1) |
12 (37.5) |
|
North African and Middle Eastern |
1 (11.1) |
7 (77.8) |
3 (33.3) |
6 (66.7) |
3 (33.3) |
|
North-East Asian |
8 (44.4) |
12 (66.7) |
9 (50.0) |
12 (66.7) |
10 (55.6) |
|
North-West European |
13 (59.1) |
6 (27.3) |
7 (31.8) |
12 (54.5) |
8 (36.4) |
|
Oceania |
53 (41.7) |
63 (49.6) |
58 (45.7) |
106 (83.5) |
56 (44.1) |
|
People of the Americas |
2 (100.0) |
2 (100.0) |
1 (50.0) |
1 (50.0) |
0 (0.0) |
|
South-East Asian |
4 (36.4) |
7 (63.6) |
7 (63.6) |
9 (81.8) |
3 (27.3) |
|
Southern and Eastern European |
6 (75.0) |
4 (50.0) |
2 (25.0) |
6 (75.0) |
2 (25.0) |
|
Sub-Saharan African |
2 (25.0) |
3 (37.5) |
3 (37.5) |
7 (87.5) |
2 (2.5) |
|
Total |
106 (44.7) |
120 (50.6) |
104 (43.9) |
184 (77.6) |
96 (40.5) |
Table 8: Chi-Square test results for ethnicity and the top five sources of information.
|
Variables |
Pearson Chi-Square |
||
|
Value |
df |
P (2-sided) |
|
|
Ethnic background and BOM website including radar |
14.332 |
8 |
0.074 |
|
Ethnic background and family members calling/texting on mobile phone |
12.613 |
8 |
0.126 |
|
Ethnic background and friends calling/texting on mobile phone |
5.210 |
8 |
0.735 |
|
Ethnic background and television |
12.588 |
8 |
0.127 |
|
Ethnic background and FM radio channel |
6.596 |
8 |
0.127 |
Table 9: Top five sources of information for low socio-economic groups.
|
Sources of information |
Household income number (%) |
Total |
|
|
Below $600/week |
Above $600/week |
||
|
BOM website including the radar |
38 (37.6) |
60 (50.0) |
98 (44.3) |
|
Family members calling and texting on mobile phone |
52 (51.5) |
57 (47.5) |
109 (49.3) |
|
Friends calling and texting on mobile phone |
42 (41.6) |
54 (45.0) |
96 (43.4) |
|
Television |
76 (75.2) |
97 (80.8) |
173 (78.3) |
|
FM radio |
37 (36.6) |
54 (45.0) |
91 (41.2) |
Level of preparedness
Table 15 shows that only 38 per cent of the CALD population groups perceived themselves as being prepared or very well prepared for an emergency. This low level of preparedness together with high exposure of Logan City to various hazards implies that Logan City Council could adopt a targeted approach to increase preparedness of residents from ethnic backgrounds. The majority of respondents who did not have a high degree of preparedness were people with Central Asian (35.5 per cent), North-West European (40.9 per cent) and Oceania (40.9 per cent) backgrounds.
Table 10: Chi-Square test results for household income and the top five sources of information.
|
Variables |
Pearson Chi-Square |
||
|
Value |
df |
P (2-sided) |
|
|
Household income and BOM website including radar |
3.404 |
1 |
0.065 |
|
Household income and family members calling/texting on mobile phone |
0.348 |
1 |
0.555 |
|
Household income and friends calling/texting on mobile phone |
0.260 |
1 |
0.610 |
|
Household income and television |
1.006 |
1 |
0.316 |
|
Household income and FM radio channel |
1.585 |
1 |
0.208 |
Table 16 shows reported levels of disaster preparedness were low for both low socio-economic and non-low socio-economic groups. This suggests that an individual’s household income did not affect the level of preparedness.
Conclusion and recommendations
The survey findings suggest that overall, attitudes towards emergency and disaster events are passive and this is a trend consistent across the vulnerable population groups. Television and contacting family members via mobile phone were the top information sources for the vulnerable population groups surveyed. Logan City Council’s resources (e.g. website, Facebook) did not rank highly as preferred sources of information for the target population. Fieldwork feedback indicated that residents perceived a lack of day-to-day engagement by Logan City Council.
Respondents indicated that they were most comfortable asking family members and friends for help, followed by Queensland Police Service, Queensland Fire and Emergency Services and Queensland Ambulance Service. Neighbours, workmates and community groups were rated low by respondents as preferred and trusted sources of information. This suggests a low level of social capital in these communities.
Table 11: Degree of comfort in asking for help by CALD populations groups.
|
Ethnic background |
#1 Most comfortable asking for help from |
#2 Most comfortable asking for help from |
#3 Most comfortable asking for help from |
|
Central Asian |
Family members (89.7%) |
Neighbours (82.1%) |
Police and Queensland Fire and Emergency Services (80.8%) |
|
North African and Middle Eastern |
Family members (87.5%) |
Logan City Council (87.5%) |
Friends (75.0%) |
|
North-East Asian |
Family members (94.4%) |
Friends (77.8%) |
Police and Queensland Fire and Emergency Services (72.2%) |
|
North-West European |
Friends (94.7%) |
Police and Queensland Fire and Emergency Services (94.1%) |
Family members (86.4%) |
|
Oceania |
Family members (92.1%) |
Police and Queensland Fire and Emergency Services (82.0%) |
Friends (75.8%) |
|
People of the Americas |
Family members (100.0%) |
Neighbours (100.0%) |
Friends (100.0%) |
|
South-East Asian |
Family members (90.9%) |
Friends (81.8%) |
Neighbours (72.7%) |
|
Southern and Eastern European |
Police and Queensland Fire and Emergency Services (100.0%) |
Family members (87.5%) |
Friends (75.0%) |
|
Sub-Saharan African |
Family members (100.0%) |
Police and Queensland Fire and Emergency Services (85.7%) |
Friends (75.0%) |
Table 12: Chi-Square test results between ethnicity and level of comfort to request help.
|
Variables |
Pearson Chi-Square |
||
|
Value |
df |
P (2-sided) |
|
|
Ethnic background and family members |
11.390 |
16 |
0.785 |
|
Ethnic background and neighbours |
27.074 |
16 |
0.041 |
|
Ethnic background and friends |
13.194 |
16 |
0.658 |
|
Ethnic background and colleagues and workmates |
17.225 |
16 |
0.371 |
|
Ethnic background and Logan City Council |
14.456 |
16 |
0.565 |
|
Ethnic background and Police and Queensland Fire and Emergency Services |
14.245 |
16 |
0.580 |
Table 13: Degree of comfort to ask for help for low socio-economic population groups.
|
Household income |
#1 Most comfortable asking for help from |
#2 Most comfortable asking for help from |
#3 Most comfortable asking for help from |
|
Below $600/week |
Family members (90.7%) |
Police and Queensland Fire and Emergency Services (79.3%) |
Friends (70.2%) |
|
Above $600/week |
Family members (93.2%) |
Police and Queensland Fire and Emergency Services ((83.9%) |
Friends (82.9%) |
Table 14: Chi-Square test results between household income and level of comfort to request help.
|
Variables |
Pearson Chi-Square |
||
|
Value |
df |
P (2-sided) |
|
|
Ethnic background and family members |
0.574 |
2 |
0.750 |
|
Ethnic background and neighbours |
3.199 |
2 |
0.202 |
|
Ethnic background and friends |
5.636 |
2 |
0.060 |
|
Ethnic background and colleagues and workmates |
0.757 |
2 |
0.685 |
|
Ethnic background and Logan City Council |
1.020 |
2 |
0.601 |
|
Ethnic background and Police and Queensland Fire and Emergency Services |
0.754 |
2 |
0.686 |
Table 15: Level of preparedness for CALD population groups.
|
Ethnic background |
Level of preparedness count (percentage %) |
Total |
||
|
Not prepared at all or slightly prepared |
Somewhat prepared |
Prepared or very well prepared |
||
|
Central Asian |
9 (29.0) |
11 (35.5) |
11 (35.5) |
31 (100.0) |
|
North African and Middle Eastern |
4 (50.0) |
1 (12.5) |
3 (37.3) |
8 (100.0) |
|
North-East Asian |
5 (27.8) |
9 (50.0) |
4 (22.2) |
18 (100.0) |
|
North-West European |
4 (18.2) |
9 (40.9) |
9 (40.9) |
22 (100.0) |
|
Oceania |
38 (29.9) |
37 (29.1) |
52 (40.9) |
127 (100.0) |
|
People of the Americas |
0 (0.0) |
2 (100.0) |
0 (0.0) |
2 (100.0) |
|
South-East Asian |
4 (36.4) |
3 (27.3) |
4 (36.4) |
11 (100.0) |
|
Southern and Eastern European |
2 (28.6) |
3 (42.9) |
2 (28.6) |
7 (100.0) |
|
Sub-Saharan African |
2 (28.6) |
2 (28.6) |
3 (42.9) |
7 (100.0) |
|
Total |
68 (29.2) |
77 (33.0) |
88 (37.8) |
233 (100.0) |
Table 16: Level of preparedness for low socio-economic population groups.
|
Level of preparedness |
Household income number (percentage %) |
Total |
|
|
Below $600/week |
Above $600/week |
||
|
Not prepared at all or slightly prepared |
31 (31.6) |
34 (28.3) |
65 (29.8) |
|
Somewhat prepared |
31 (31.6) |
43 (35.8) |
74 (33.9) |
|
Prepared or very well prepared |
36 (36.7) |
43 (35.8) |
79 (36.2) |
Drawing on literature and the survey findings, a two-pronged collaborative approach is proposed to facilitate effective engagement with vulnerable population groups. Firstly, community engagement activities should incorporate the use of traditional mass media (e.g. television and radio) and social media tools as part of an integrated approach for effective dissemination of information. One effective strategy could be to proactively engage television stations to develop newsworthy disaster-related segments in the lead-up to key disaster messaging periods, while maintaining a consistent and active social media presence and messaging across multiple platforms, e.g. Facebook and Twitter. This can be complemented by a partnership approach with Queensland Police Service, Queensland Fire and Emergency Services and Queensland Ambulance Service to develop a complementary methodology for information-sharing and dissemination.
Secondly, proactive and face-to-face engagement with vulnerable population groups would help to build trust that can be tapped into in an emergency and disaster event. This may be achieved through collaborative community partnering that focuses on the role that grassroots and other community groups (including NGOs) can play in engaging, educating and involving community members from vulnerable population groups as active participants in community and personal preparedness.
Footnotes
- Socio-Economic Indexes for Areas are at www.abs.gov.au/websitedbs/censushome.nsf/home/seifa