Knowledge of the hazards, protective actions and the language used in warning messages is essential for safety and informed decision-making particularly during flash flooding and hazardous weather events. Equally important for effective risk communication is knowledge of what recipients already know and the inclusion of context and uncertainty information in forecasts and warnings. There is limited empirical research about how people interpret warnings based on their levels of knowledge and past experiences. A survey of 1,235 people was conducted to understand people’s knowledge of the causes of flash flood, the risks, effects, protective actions and definitions as well as interpretations of terms of likelihood used in rainfall warnings. Survey results showed that the hypothesis that emergency management practitioners had more knowledge of flash flood than the public was only partially supported. Results showed gaps in understanding, in particular, the verbal probabilistic terms of 'likely' and 'possible' that are used in rainfall warnings were interpreted inconsistently. This presents a challenge when communicating uncertainty. This study shows the need to improve the communication of uncertainty in forecasts and warnings and advises the use of defined numerical probabilities with verbal terms.
Introduction
Flash floods are generally difficult to predict and, when they can be predicted, there is often little time remaining before onset (WMO 2012). This makes flash flooding challenging to forecast, warn for and leaves those at risk with reduced capacity to take timely and appropriate protective actions. Being caught unaware by flash flooding, crossing flood waters and exposure during outdoor activities are leading causes of flood-related fatalities in Australia (Fitzgerald et al. 2010; Haynes et al. 2009, 2017). According to Deloitte Access Economics (2021), severe storms and floods are among the most economically costly types of high-risk hazards in Australia each year. To effectively communicate risk, it is important that people receive the information, understand the message and the potential effects of the hazard as well as what actions they can take to protect themselves (Kuligowski et al. 2024; Lazrus et al. 2016; Paton 2019).
Multi-hazard early warning systems are identified as a cost-effective tool and can reduce economic losses and provide a 10-fold return on investment (UNDRR and WMO 2024; WMO 2022). End-to-end early warning systems integrate risk knowledge, hazard monitoring and forecasting, warning dissemination and communication as well as preparedness and response to enable people to take timely action to reduce their risks (UNDRR and WMO 2024; WMO 2022, 2024). Community resilience and safety is dependent on effective, people-centred warning systems that deliver relevant and actionable information to those at risk (Argyris 2005; Dallo et al. 2022; Kirchhoff et al. 2013; WMO 2022).
To be informed and reduce risks, communities need early warnings (Box et al. 2016). Communication techniques and warning messages should be evaluated to assess their effectiveness and help prevent unintended outcomes (Dallo et al. 2022; Nickerson 1999; Sutton et al. 2025). People's understanding of forecasts and warnings and their response can be improved through revisions to products and services and changes in forecast design (Carr et al. 2016; Demuth et al. 2013; WMO 2024). Research, for example, Cawood et al. (2018), Dufty (2014) and Hamilton et al. (2019) shows that flash flood warning systems in Australia (including forecasting, warning messaging and salient communications) require improvement to enhance early warnings and support informed decision-making.
Communication is a key factor for risk interpretation, decision-making, actions and responses and, therefore, greatly affects the consequences of severe weather and natural hazard events (Khan et al. 2017). While information-seeking pathways (that is, how individuals search for further information before taking action once aware of a threat) may be different during flash flooding to those for slow-moving floods, people used similar sources of information; effective (good) communication is key (Ryan 2018). Effective communication requires a reasonably accurate understanding of what others know (Lazrus et al. 2016; Nickerson 1999). Misjudging their knowledge can lead to communication difficulties and misunderstandings. Furthermore, understanding the perspectives and decision-making contexts of people helps in the communication of actionable knowledge (i.e. information that is usable and relevant to help people in making informed decisions about their safety, risk and actions) (Argyris 2005; Dallo et al. 2022; Lazrus et al. 2016).
How weather information is communicated including presentation, language, framing and visualisation can influence risk perception and decision-making (e.g. Clive et al. 2023; Demuth et al. 2013; Stephens et al. 2019). Users need both a forecast and an indication of how confident they can be in it to enable decisive actions and reduce the need for contingency planning (Fischhoff 1994). Uncertainty can lead to maladaptive behaviours, including delaying decisions (Lipshitz and Strauss 1997) or seeking additional confirmatory information (Wood et al. 2018). This increases the potential for harm in high-risk situations where quick decisions may be needed, such as in flash floods. Furthermore, if uncertainty is not expressed in a forecast, people lack information relevant to decision-making and may guess the levels of certainty/confidence/likelihood (Fischhoff 1994; Joslyn and Savelli 2010; Morss et al. 2008; Stephens et al. 2019). Guessing the certainty incorrectly can lead to exceedingly cautious or highly risky actions (Fischhoff 1994). Empirical research shows that the inclusion of uncertainty information or probabilities in weather forecasts and warnings can help prevent miscommunication and improve decision-making interpretations and proficiency (Joslyn and Savelli 2021; Ripberger et al. 2022; WMO 2008).
Probabilistic information and forecasts are becoming more readily available and qualitative and quantitative descriptions of probability (i.e. uncertainty information) is more likely to be included in future weather services and risk communications (Ripberger et al. 2022; Stuart et al. 2022). Appropriately communicated uncertainty or probability information can improve people's decision-making proficiency and lead to greater trust in the information (Joslyn and Savelli 2021; National Research Council 2006; Ripberger et al. 2022). However, warning messages and risk communication studies show that verbal expressions of uncertainty and probability, such as 'likely' and 'possible' can be interpreted differently by different individuals (Fischhoff 1994; Ho et al. 2015; National Research Council 2006). Interpretation and comprehension are influenced by the context in which information is used, the decision-maker's circumstances and how the information is framed (Doyle et al. 2019; Joslyn and Savelli 2021; National Research Council 2006). Thus, it is important to examine if probability terminology and uncertainty information is interpreted by users as intended by the providers of a forecast (Fischhoff 1994; Ho et al. 2015).
Preparedness and response to hazards like flash floods are shaped by factors including knowledge, skills, behaviours, attitudes, experience, social context, demographics, risk perception, uncertainty and self-efficacy (Eiser et al. 2012; Paton 2019; Sherman-Morris 2013). Understanding how these factors influence poor outcomes across diverse communities and contexts helps to inform effective and locally relevant risk mitigation approaches (Haynes et al. 2017; Lazrus et al. 2016; Taylor et al. 2018). To competently respond to a flash flood forecast or warning an individual requires knowledge of the hazard and what to do or how to stay safe (Paton 2019). This process involves identifying, personalising and prioritising the risk, recognising the need for action to ensure safety or risk mitigation and assessing the resources, capacity and ability to take the appropriate protective actions (Eiser et al. 2012; Paton 2019; Slovic 2016). Decision-making in real-world situations, such as operational forecasting, emergency management and responding to severe weather events, can be characterised as decision-making under uncertainty. In these dynamic environments, people (actors) are making decisions with incomplete information (Lipshitz and Strauss 1997; Klein et al. 1993; Eiser et al. 2012). Under time pressure and high-risk conditions, people rely on their experience, intuition and pattern recognition to make decisions (Klein 2015; Klein et al. 1993). However, to make 'good' or competent decisions, expertise (i.e. knowledge and skills) are important (Klein 2015; Klein et al. 1993). Education and training to develop expertise can help people to make more proficient decisions and increase safety and efficiency (Klein 2015; Klein et al. 1993).
Knowledge and experience are also important in perceiving risk and responding to weather warnings (Eiser et al. 2012; Paton 2019; Sherman-Morris 2013). However, the influence of knowledge and experience on risk perception, decision-making and preparedness can be contradictory and warrants further investigation. For example, knowledge and past experience may increase or decrease perceived risk and preparedness depending on circumstances, the hazard and the individual (Box et al. 2016; Demuth 2018; Paton 2019). People may overestimate their knowledge levels and abilities (perceived knowledge) compared to their actual (objectively measured or assessed) knowledge (Casteel 2023; Lichtenstein and Fischhoff 1977; Nunley and Sherman-Morris 2020). This overconfidence bias can place people at greater risk of decision errors and harm (Lichtenstein and Fischhoff 1977). Experts often have more opportunities to gain experience and feedback in their specialist areas, greater knowledge about a hazard and associated risks and employ different (more effective) decision-making strategies to make highly reliable and accurate judgements (Morgan et al. 2002; Klein et al. 2017; Klein 2015). Anecdotally, it may be assumed that emergency management practitioners have more knowledge and experience than people in the community (i.e. the public) and a greater understanding of weather hazards, preparedness and protective actions.
Studies exploring community and emergency management communication, preparedness and response to flash flooding in Australian contexts remain scarce. There is evidence that the general understanding of flood risk among communities is relatively low (Metrix 2019). Similarly, there is limited research into the depth of knowledge held by emergency management practitioners regarding flash floods, particularly in relation to flash flood predictability, how they differ from riverine flooding and the types of locations that are most at risk. Australian research has examined flood risk communication and warning design (Tippett et al. 2021; Mehta et al. 2022; Taylor et al. 2019), flash flood fatalities and behaviour (Hamilton et al. 2019; Haynes et al. 2009, 2017, 2018) and information pathways (Bird et al. 2012; Ryan 2018). However, public perceptions of verbal probability terms such as 'likely' and 'possible' and understanding of technical terminology such as 'heavy' and 'intense' in the context of rainfall forecasts or warnings has not been systematically tested in Australian populations.
Aim
This exploratory study aimed to establish a baseline understanding of public and emergency management knowledge of flash flooding with a particular focus on how people interpret the communication of uncertainty in weather warnings related to such events. For the purposes of this study, the term ‘emergency management’ is used broadly to encompass salaried workers, volunteers, organisations and individuals involved in the provision of services and the organisation and management of resources to deal with emergencies, including prevention, response and recovery (AIDR 2023). Study participants self-selected as being currently or previously involved in the emergency services (emergency management sector) or not (categorised as the public group).
Research questions were:
- RQ1: What are the levels of knowledge of emergency management practitioners and the public about the causes, dangers, predictability, and appropriate protective actions related to flash floods?
- RQ2: Are there differences between emergency management practitioners and the public regarding their knowledge of flash flood?
- RQ3: Do people understand the terminology used in forecasts and warnings?
Materials and methods
Design
An online survey was used as a part of an inter-disciplinary and mixed-methods research project for Natural Hazards Research Australia - Flash Flooding Case Studies to Improve Predictions and the Communication of Uncertainty. The survey explored people's perceptions of flash flooding in the Australian context. It focused on factors that influence warning response including flash flood knowledge, risk, uncertainty and terminology used in Bureau of Meteorology (the Bureau) heavy rainfall warning messages. This paper uses a subset of the survey findings to test hypotheses and answer research questions.
The hypotheses for this study were:
- H1 - Public perceive flash flood to be more predictable (forecasting difficulty) than emergency management.
- H2 - Public have lower perceptions of the importance of various environmental factors that contribute to flash flood risk than emergency management.
- H3 - Public have lower flash flood knowledge (including definitions, causes, terminology/rainfall types, protective actions) than emergency management.
- H4 - Public have lower perceptions of how likely various impacts are during a flash flood than emergency management.
- H5 - Interpretations of the uncertainty and rainfall terminology used in forecasts and warnings varies.
Ethics
The research design and survey materials were reviewed by the research team following the guidelines of the National Statement on Ethical Conduct in Human Research (NHMRC et al. 2023) and criteria for low-risk research. The data collection and survey questions were considered in line with the Privacy Act 1988 and the Bureau's Privacy Threshold Assessment Tool (rated low level risk). No private, sensitive, identification nor personal information was intentionally solicited or collected. All respondents were over 18 years and participation was anonymous. Before starting the survey, participants were provided with information about the study and all gave informed consent. The consent included permission to store and use deidentified data for future related research.
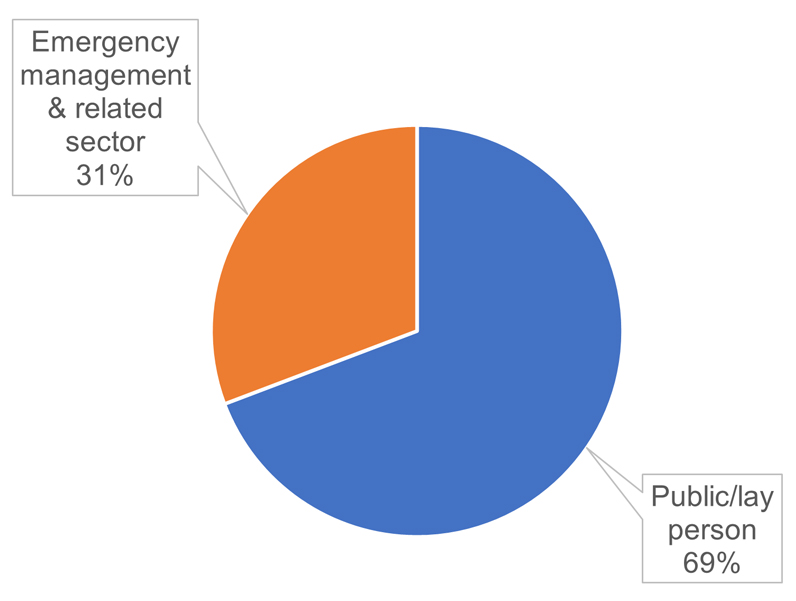
Figure 1: Number of participants from the emergency management and related sectors and public group.
Measures
The online survey contained 20 questions and took an average of 16 minutes to complete. The complete survey instrument is available at https://osf.io/pg5f9/?view_only=d0ec04200bca4981a827efb79a509240. The variables examined in this study:
- Perceived knowledge was measured using 5 items, original and adapted from Clive et al. (2023); Heinrich (2022) and Nunley and Sherman-Morris (2020). Items measured perceived flash flood knowledge, self-efficacy and knowledge of rainfall terminology on a 5-point Likert scale from 'Strongly disagree' (1) to 'Strongly agree' (5). This scale showed good reliability α =.794, ω =.795 (mean sum score 21.32, SD 3.17) and structurally the items loaded onto one factor that explained 55% of the variance.
- Flash flood predictability (forecasting difficulty) was measured using one item, 'Flash floods are easy to forecast', on a 5-point Likert scale from 'Strongly disagree' (1) to 'Strongly agree' (5).
- Importance of flash flood risk factors measured knowledge of flash flood risk factors by rating 8-items/factors adapted from Morss et al. (2016) on how important each environmental factor was for determining flash flood risk on a 5-point Likert scale from 'Not at all important' (1) to 'Extremely important' (5) with a 'Don't know' option. This scale showed lower reliability that is acceptable for preliminary research (Peterson 1994) α =.671, ω =.674 (mean sum score 24.53, SD 3.44). Structurally, the items loaded onto one factor that explained 39% of the variance.
- Assessed knowledge drew out aspects of general flash flood knowledge such as knowing the causes and definition of flash flood, rainfall terms used by the Bureau and protective actions as measured using 4 multiple-choice questions, original and adapted from Morss et al. (2016). Responses that were completely correct were scored as 1 (Correct), partially correct and incorrect answers scored as 0. Correct scores were summed to give an overall assessed knowledge score.
- Knowledge of flash flood effects assessed risk or perceived harm was measured by rating 8 items adapted from Morss et al. (2016) on how likely each item is to occur in a flash flood event on a 5-point Likert scale from 'Not at all likely' (1) to 'Extremely likely' (5), with a 'Not sure' option. This scale showed good reliability α =.851, ω =.853 (mean sum score 30.25, SD 5.20). Structurally, the items loaded onto one factor that explained 50% of the variance.
- Terminology included uncertainty communication comprehension measured with questions adapted from Morss et al. (2016) and based on common terminology and heavy rain warning messaging issued by the Bureau at the time of survey construction. Each participant was randomly allocated to a group that received 2 of the 4 warning message questions where the verbal terms 'likely' or 'possible' and hazard type (heavy rain/flash flood) varied (see Figure 12).
- Confidence was measured by participants rating their confidence that the answer they provided was correct on a scale of 0-100% following a number of the questions including knowledge of flash flood definitions, 'heavy' and 'intense' rainfall, causes of flash flood, protective actions and the likelihood of flash flooding or heavy rainfall given a warning message.
- Experience with flood hazards and professional involvement was recorded. Participants were categorised as public or emergency management sector using the question 'Are you currently or have you ever been involved with emergency services? (including, as a professional, volunteer, training, water sector, crisis management, weather services, warning services, emergency management)' to allow comparisons between groups.
- Demographics examined the geographic spread of responses and participants were asked for their main residential postcode. No further demographic information was collected to comply with privacy and ethics considerations.
Procedure
Participants over 18 years old were invited to complete the online survey. The convenience sample was recruited through snowball sampling that leveraged the networks of the Bureau and Natural Hazards Research Australia. This included sharing the survey link via emails, social media, Bureau user groups, the BOMIdeas emailing list, newsletters, public meetings and conferences.
Participants viewed a study information sheet and gave informed consent before proceeding with the survey. In a ‘within-‘ and ‘between-groups’ design, participants were randomly allocated to one of 4 groups/conditions. Participants received identical questions except in the terminology/warning message section where each treatment condition received alternative wording. Following Nunley and Sherman-Morris (2020), perceived knowledge was examined before assessed knowledge. Multiple-choice responses and matrix tables randomly displayed options. The survey was pilot tested by the research team and colleagues prior to public release. The survey was open from 22 February to 13 May 2024. A total of 1,454 responses were received, of which 219 were incomplete. Incomplete responses were deleted, leaving a sample of 1,235 responses to be analysed. The emergency management (n = 380) and public (n = 855) groups were the same sample size for all group comparison tests.
Data analysis
In this exploratory mixed-methods study, quantitative (numbers) and qualitative (open text) data were collected. Quantitative data was statistically analysed using MS Excel and JASP. Non-parametric tests were used as the data did not meet all the assumptions of normality. Cronbach's alpha (α), coefficient omega (ω) and principal component factor analysis (promax rotation) were used to examine scale reliability, structure and dimensionality. Mann-Whitney U tests were used to compare between groups (emergency management and public) and test our hypotheses. Quantitative analyses were reported as statistically significant at alpha p <.05.
Results
Participants
Participants were Australian residents aged 18 years or older comprising members of the public and individuals from communities associated with Bureau stakeholders including first responders and those engaged in emergency services (Figure 1). Participants (n = 1,235) were geographically spread around Australia (Figure 2). Over half had experienced some form of flooding (Figure 3), 38% in an urban environment, 31% in a rural setting.
Knowledge of flash flood
Most participants indicated agreement to strong agreement with the flash flood knowledge statements, showing high perceived knowledge of terminology and protective behaviours relating to heavy rainfall warnings and flood (Figure 4). Thus, participants believed that they knew about flash floods, rainfall terminology and protective behaviours relating to heavy rainfall warnings and flash flood. Emergency management participants reported slightly higher perceived knowledge scores than the public. This difference was statistically significant (Mann-Whitney U tests (U) = 134395.50, p = <.001, SE Rank-Biserial Correlation = -.137 95% CI [-0.206, -0.066]).
Most participants disagreed with the statement 'flash floods are easy to forecast' (Figure 5). This statement was examined using a Mann-Whitney U test to test the hypothesis that the public has lower perceptions of flash flood predictability (forecasting difficulty) than those in emergency management (H1). Hypothesis H1 was not supported (U = 158814.50, p =.506 (not significant), SE Rank-Biserial Correlation = -.022 95% CI [-0.092, 0.047]).
Participants rated the importance of various environmental factors that contribute to flash flooding (Figure 6). Comparison of the total importance of flash flood risk factors scores showed that emergency managers perceived the items as more important overall compared to the public group (U = 135079.50, p <.001, SE Rank-Biserial Correlation = -.132 95% CI [-0.202, -0.062]). There was support for the hypothesis that the public have lower perceptions of the importance of various environmental factors that contribute to flash flood risk than emergency management (H2). Comparison of the emergency management to public responses for individual scale items showed no significant statistical differences for 'the amount of rain in the last 24 hrs' and 'past history of flash flooding at the location'. Emergency management rated all other risk factor items as more important.
We assessed participants' actual flash flood knowledge across several survey questions relating to the definition of flash flood, rainfall terminology, causes of flash flood and appropriate protective actions. Hypothesis H3, that the public has lower flash flood knowledge than the emergency management group was tested using Mann-Whitney U tests for each of these questions.
Results show that most participants knew the causes of flash flooding (Figure 7). There were no statistically significant differences between emergency management and public groups apart from the item 'short bursts of heavy rainfall such as from thunderstorms' (Table 1). Thus, there was limited, partial support for hypothesis H3, that the public has lower flash flood knowledge than emergency management around the causes of flash flood.
There were no statistically significant differences between emergency management and public group’s definitions except for the item 'flooding that happens within 6 hours of rain falling' (Figure 8 and Table 2). Thus, there was limited, partial support for hypothesis H3, that the public have lower knowledge of flash flood definitions than emergency management.
Results show that 66% of participants knew that the difference between heavy and intense rainfall is that 'over the same time period, intense rainfall corresponds to a greater amount of rainfall' (Figure 9). There were no statistically significant differences between emergency management and public group’s knowledge of intense and heavy rainfall (Table 3). Thus, hypothesis H3, that the public has lower flash flood knowledge around the terms used to describe rainfall than emergency management was not supported.
Results show that participants knew appropriate actions and behaviours to keep themselves safe if they received a warning for heavy rainfall that may lead to flash flooding (Figure 10). There were statistically significant differences between emergency management and public groups for the items 'watch for changing weather conditions' and 'check for advice and updates from your local emergency services and/or radio station', which were more often selected by emergency management participants when compared to the public (Table 4). Overall, emergency management participants selected all appropriate responses (correct score) more often than the public participants and this difference was statistically significant. There was support for hypothesis H3, that the public has lower knowledge of appropriate protective actions in response to flash flooding than emergency management.
Total knowledge scores (sum of correct responses across the 4 knowledge questions) were low overall. In comparing total knowledge scores, the emergency management group had slightly higher scores (mean 1.15, SD 1.08) than the public group (mean 0.97, SD 1.06) and this difference was statistically significant, supporting H3 (U = 178249.0, p =.004, SE Rank-Biserial Correlation =.097 95% CI [0.028, 0.166]). While H3 (that public had less flash flood knowledge) was partially supported, overall, emergency management participants were more confident than the public that their responses to the 4 knowledge questions were correct. This assessment was accurate when we compare total assessed knowledge scores. The group differences in confidence were statistically significant (Tables 1, 2, 3 and 4).
Participants were asked to rate how likely they thought the various impacts would be during a flash flood event (Figure 11). There were no statistically significant differences between the emergency management and the public groups. The hypothesis that the public has lower perceptions than emergency management participants of how likely various flash flood impacts are during a flash flood event (H4) was not supported.
Interpretations of uncertainty terminology in heavy rainfall warnings
Participants received 2 of 4 warning messages depending on the random group allocation (Figure 12). The warning messages were identical apart from the use of terms of ‘likely’ or ‘possible’. Participants were asked to indicate the likelihood (per cent chance) of either flash flooding or heavy rain. A follow-up question asked respondents to indicate their confidence in the likelihood value they reported.
Comparing the reported likelihood values between groups, Kruskal-Wallis tests show that there was a statistically significant difference in likelihood values reported between the different hazard (flash flood, heavy rain) and wording conditions (likely, possible); hazard (H (1) = 377.03, p <.001), terminology wording (H (1) = 19.96, p <.001). Comparing likelihood values reported within subjects, Wilcoxon signed-rank tests showed that participants perceived a statistically significant difference in the mean likelihood of flash flooding or heavy rainfall when the words 'possible' and 'likely' were used. (Group 1 W = 5262.00, p <.001, SE Rank-Biserial Correlation = -.332 95% CI [0.086, -0.173], Group 2 W = 2291.50, p <.001, SE Rank-Biserial Correlation = -.595 95% CI [-0.094, -0.463], Group 3 W = 1829.00,
p <.001, SE Rank-Biserial Correlation = -.844 95% CI [0.078, -0.794], Group 4 W = 19119.00, p <.001, SE Rank-Biserial Correlation =.884 95% CI [0.081, 0.914]).
These results support our hypothesis (H5) that participants have different understandings and interpretations of the terminology used by the Bureau in heavy rainfall warnings and forecasts. Raincloud plots show the distributions of the likelihood values reported by participants, visualising the differences found (Figure 13). Higher likelihood values were more often reported for the ‘likely’ term. The spread or range of values was narrower when likely was used in the warning message. In the warning scenarios participants generally reported higher likelihoods for the occurrence of heavy rainfall than for flash flood events.
Table 5 shows a summary of the hypothesis testing results.
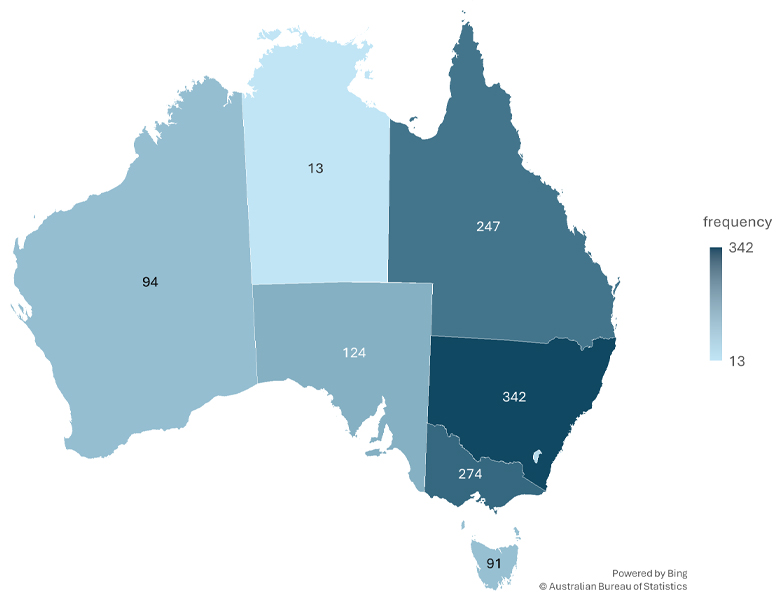
Figure 2: Number of participants by state (from provided postcode). Note: not all participants provided postcodes.
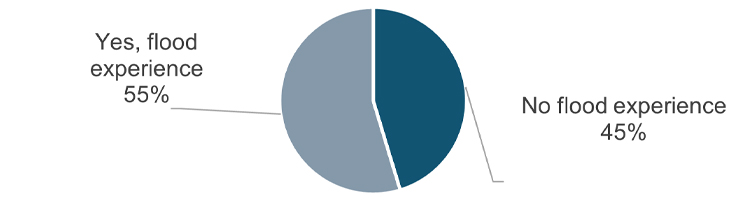
Figure 3: Participants' past flood event experiences.
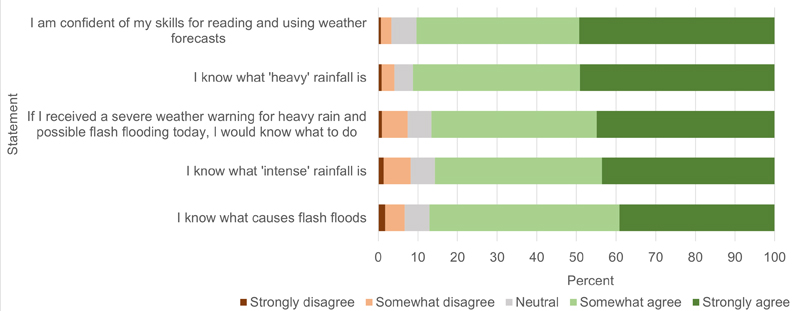
Figure 4: Participants' subjective assessments of their knowledge levels (perceived knowledge); ‘how much you agree or disagree with each statement’. Participants reported agreement with most statements indicating higher perceived knowledge.
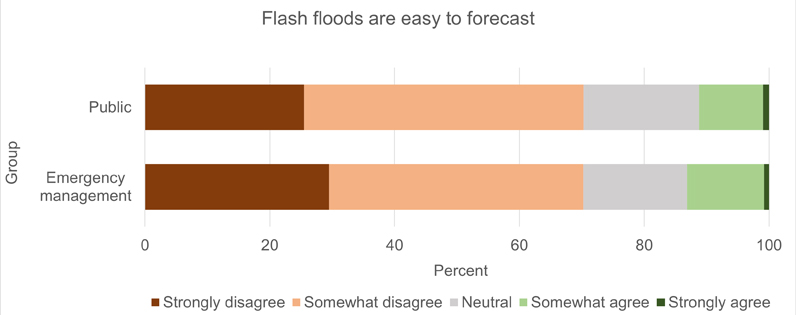
Figure 5: The public and emergency management participants' perceptions of the predictability of flash floods. Agreement with the item 'flash floods are easy to forecast'.
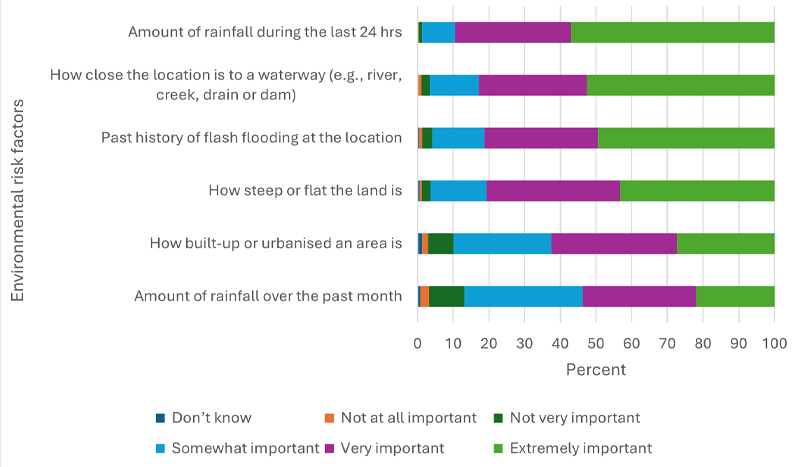
Figure 6: Rating of the importance of each factor in determining the risk of flash flooding at a given location. All these factors influence flash flood risk and some are not well known.
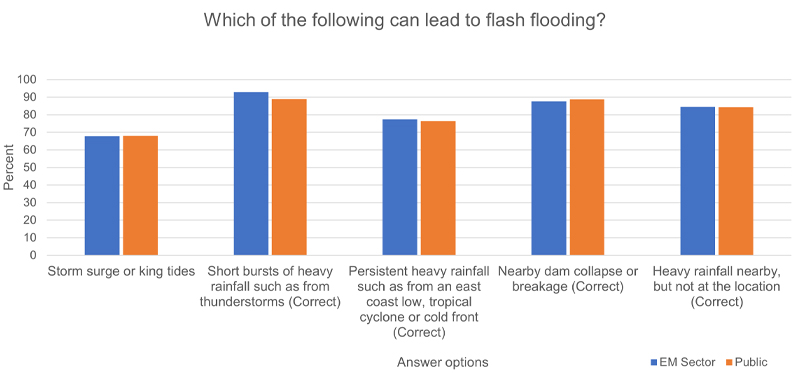
Figure 7: Assessed knowledge of the causes of flash flooding. All correct responses, no incorrect responses selected = emergency management 9%, public 8%. Mean confidence answer provided is correct = emergency management 82%, public 78%.
Table 1: Comparison between emergency management and public groups on their assessed knowledge of the causes of flash flooding.
| 95% CI for Rank-Biserial Correlation | |||||
| U | p | Rank-Biserial Correlation | Lower | Upper | |
| Short bursts of heavy rainfall such as from thunderstorms | 156132.5 | .034 | -0.039 | -0.108 | 0.031 |
| Storm surge or king tides | 162545 | .984 | 5.848×10⁻⁴ | -0.069 | 0.07 |
| Persistent heavy rainfall such as from an east coast low, tropical cyclone or cold front | 161025 | .736 | -0.009 | -0.078 | 0.061 |
| Nearby dam collapse or breakage | 164302.5 | .563 | 0.011 | -0.058 | 0.081 |
| Heavy rainfall nearby, but not at the location | 162212.5 | .948 | -0.001 | -0.071 | 0.068 |
| FF knowledge 3 correct Which of the following can lead to flash flooding? | 164112.5 | 0.552 | 0.01 | -0.059 | 0.08 |
| How confident you are that the answer you just provided is correct. | 183622.5 | < .001 | 0.13 | 0.061 | 0.198 |
Note: For the Mann-Whitney test, effect size is given by the rank-biserial correlation.
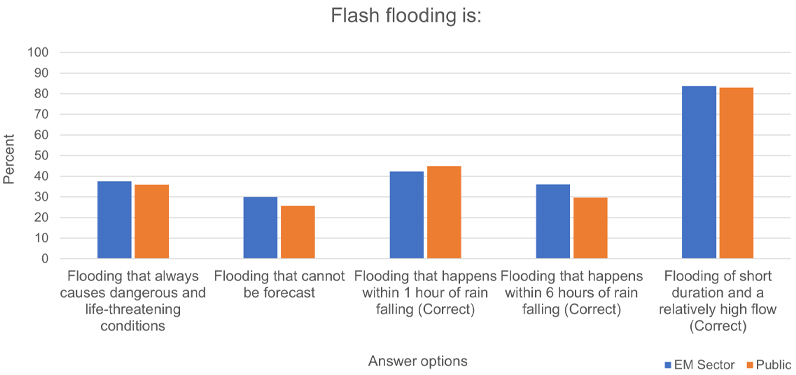
Figure 8: Assessed knowledge of the flash flooding definitions. All correct responses, no incorrect responses selected = emergency management 5%, public 3%. Mean confidence answer provided is correct = emergency management 75%, public 70%.
Table 2: Comparison between emergency management and public groups on their assessed knowledge of flash flooding definitions.
| 95% CI for Rank-Biserial Correlation | |||||
| U | p | Rank-Biserial Correlation | Lower | Upper | |
| Flooding that happens within 1 hour of rain falling | 166582.500 | 0.406 | 0.025 | -0.044 | 0.095 |
| Flooding that cannot be forecast | 155515.000 | 0.119 | -0.043 | -0.12 | 0.027 |
| Flooding that happens within 6 hours of rain falling | 152142.500 | 0.027 | -0.063 | -0.133 | 0.006 |
| Flooding that always causes dangerous and life-threatening conditions | 159647.500 | 0.561 | -0.017 | -0.087 | 0.052 |
| Flooding of short duration and a relatively high flow | 161405.000 | 0.780 | -0.006 | -0.076 | 0.063 |
| FF knowledge 1 correct Flash flooding is: | 165205.000 | 0.138 | 0.017 | -0.053 | 0.087 |
| How confident you are that the answer you just provided is correct. | 187219.500 | < .001 | 0.152 | 0.084 | 0.220 |
Note: For the Mann-Whitney test, effect size is given by the rank-biserial correlation.
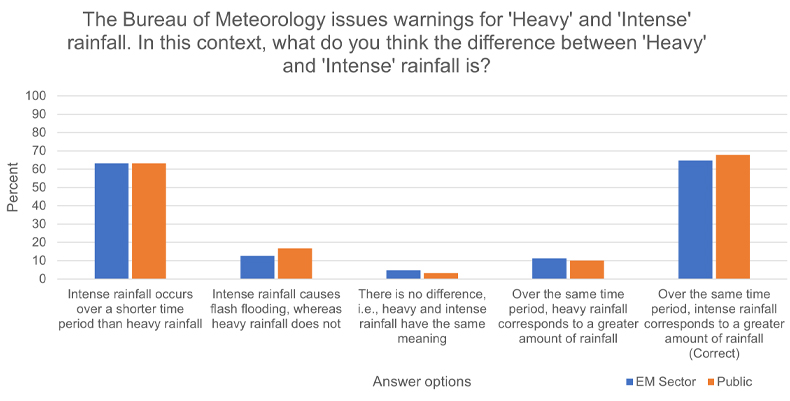
Figure 9: Assessed knowledge of the differences between 'heavy' and 'intense' rainfall. All correct responses, no incorrect responses selected = emergency management 28%, public 28%. Mean confidence answer provided is correct = emergency management 74%, public 71%.
Table 3: Comparison between emergency management and public groups on their assessed knowledge of the differences between 'heavy' and 'intense' rainfall.
| 95% CI for Rank-Biserial Correlation | |||||
| U | p | Rank-Biserial Correlation | Lower | Upper | |
| Intense rainfall occurs over a shorter time period than heavy rainfall | 162640 | .969 | 0.001 | -0.069 | 0.071 |
| Intense rainfall causes flash flooding, whereas heavy rainfall does not | 169100 | .066 | 0.041 | -0.029 | 0.11 |
| There is no difference, i.e. heavy and intense rainfall have the same meaning | 160075 | .211 | -0.015 | -0.084 | 0.055 |
| Over the same time period, heavy rainfall corresponds to a greater amount of rainfall | 160407.5 | .505 | -0.013 | -0.082 | 0.057 |
| Over the same time period, intense rainfall corresponds to a greater amount of rainfall | 167485 | .286 | 0.031 | -0.039 | 0.1 |
| FF Knowledge 2 correct the difference between 'Heavy' and 'Intense' rainfall is? | 161167.5 | .776 | -0.008 | -0.078 | 0.062 |
| How confident you are that the answer you just provided is correct. | 174989 | .030 | 0.077 | 0.008 | 0.146 |
Note: For the Mann-Whitney test, effect size is given by the rank-biserial correlation.
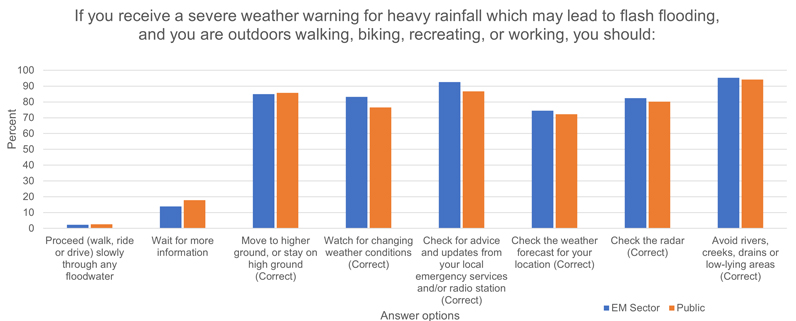
Figure 10: Assessed knowledge of appropriate protective actions. All correct responses, no incorrect responses selected = emergency management 41%, public 32%. Mean confidence answer provided is correct = emergency management 84%, public 80%.
Table 4: Comparison between emergency management and public groups on their assessed knowledge of appropriate protective actions.
FF knowledge 1 correct Flash flooding is:165205.0000.1380.017-0.0530.087How confident you are that the answer you just provided is correct.187219.500< .0010.1520.0840.220
| 95% CI for Rank-Biserial Correlation | |||||
| U | p | Rank-Biserial Correlation | Lower | Upper | |
| 163637.5 | .736 | 0.007 | -0.062 | 0.077 | |
| Watch for changing weather conditions | 151620 | .008 | -0.067 | -0.136 | 0.003 |
| Check for advice and updates from your local emergency services and/or radio station | 152760 | .002 | -0.060 | -0.129 | 0.010 |
| Proceed (walk, ride or drive) slowly through any floodwater | 162972.5 | .743 | 0.003 | -0.066 | 0.073 |
| Wait for more information | 168862.5 | .086 | 0.039 | -0.030 | 0.109 |
| Check the weather forecast for your location | 158697.5 | .400 | -0.023 | -0.093 | 0.047 |
| Check the radar | 158792.5 | .354 | -0.023 | -0.092 | 0.047 |
| Avoid rivers, creeks, drains or low-lying areas | 160645 | .430 | -0.011 | -0.081 | 0.059 |
| % all correct responses, no incorrect responses selected | 177127.5 | .002 | 0.090 | 0.021 | 0.159 |
| Mean confidence answer provided is correct | 187820.5 | < .001 | 0.156 | 0.087 | 0.223 |
Note: For the Mann-Whitney test, effect size is given by the rank-biserial correlation.
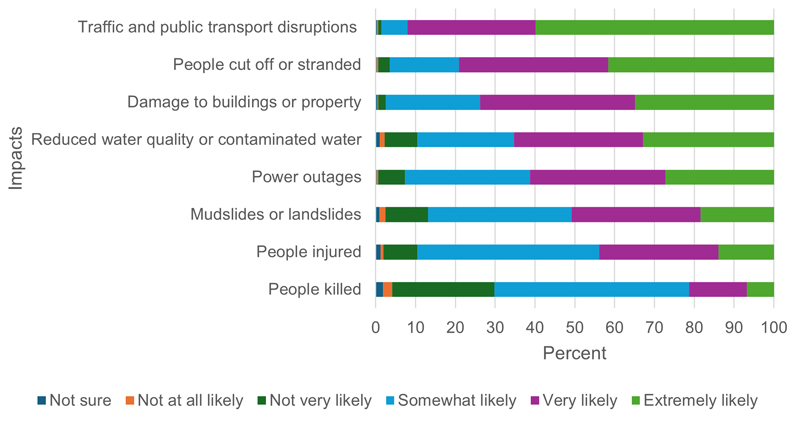
Figure 11: Ratings of likelihood of different events occurring in a flash flood event.
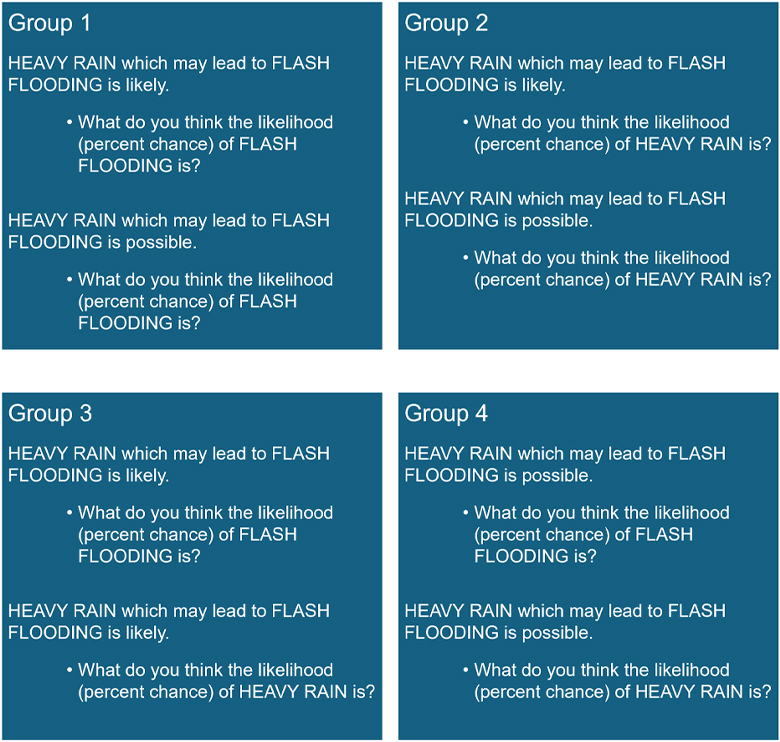
Figure 12: Heavy rain warning messages viewed by each group in the random conditions.
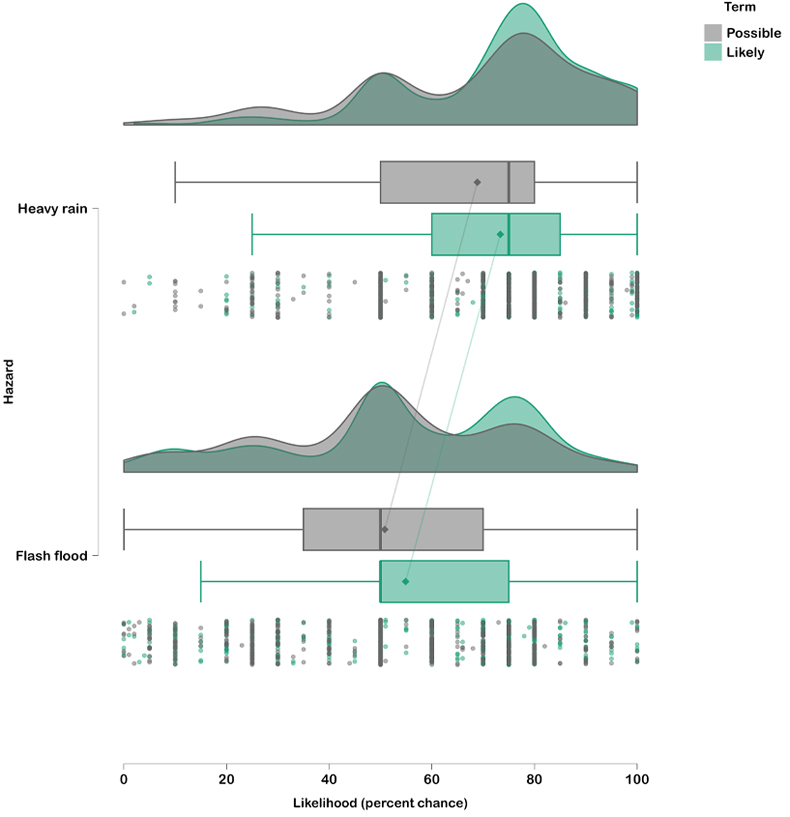
Figure 13: Raincloud plots visualising the density of the likelihood values in each condition. Comparison by hazard of the wording ‘likely’ and ‘possible’.
NOTE: In interpreting the warning message, participants reported higher values for possible heavy rain than flash flood, and higher values for heavy rain than flash flood likelihood in the likely wording condition. Reported values ranged from 0 to 100%. Means are shown for each condition (Likely wording condition: Heavy rain likelihood M = 73.35, SD = 18.17), (Possible wording condition: Heavy rain likelihood M= 68.87, SD 22.08), (Likely wording condition: Flash flood likelihood M = 54.89, SD = 23.82), (Possible wording condition: Flash flood likelihood M = 50.84, SD = 23.39) (JASP software 2025).
Discussion
Preparedness involves developing knowledge and capacities across individuals, communities, organisations and governments to anticipate, respond to and recover from weather hazard events (Paton 2019). Many factors influence community and individual preparedness and warning response capacity, capability and competency, and, thus, people's ability to make appropriate decisions and stay safe during severe weather events like flash flood (Eiser et al. 2012; Paton 2019; Sherman-Morris 2013). This study examined public and emergency management practitioners' perceptions and knowledge of flash flood and interpretation of uncertainty terms used in severe weather warnings for heavy rainfall.
To answer research questions, participants rated their flash flood knowledge (perceived knowledge), then measured their assessed knowledge and interpretations of uncertainty terms. Five hypotheses were used to examine if there were differences between emergency management and the public’s perceptions and knowledge (Table 5). The findings reveal variability in knowledge levels across individuals and between the public and emergency management groups with some consistent gaps in understanding identified across both cohorts.
The results showed an inconsistent interpretation of verbal probabilistic terms such as 'likely' or 'possible’, highlighting a critical communication gap in current heavy rainfall warnings. Results suggest that current approaches to conveying uncertainty are insufficient and that flash flood remains poorly understood.
Forecasts and warnings that are most effective to support decision-making and desirable public safety outcomes provide understandable, actionable weather and uncertainty information (Argyris 2005; Dallo et al. 2022; Lazrus et al. 2016; Stuart et al. 2022). Behaviour-orientated flood warnings may improve public understanding and motivate appropriate actions (Mehta et al. 2022). While appropriately communicated probability information in forecasts improves decision quality and trust, vague and unclear wording can lead to miscommunication and misunderstandings (Greer et al. 2020; Doyle et al. 2019; Ripberger et al. 2022). These findings underscore the need for clear, standardised forecasts and warnings that communicate hazard risk via a range of communication approaches including verbal probability terms, context and numerical probabilities.
Table 5: Summary of hypothesis tests comparing perceptions and knowledge of flash flood, terminology and language used in Bureau warnings.
| Hypothesis | Variables | Test result | |
| H1 | Public perceive flash flood to be more predictable (forecasting difficulty) than emergency management. | Flash flood predictability (forecasting difficulty): | Not supported |
| H2 | Public have lower perceptions of the importance of various environmental factors that contribute to flash flood risk than emergency management. | Importance of flash flood risk factors | Supported |
| H3 | Public have lower flash flood knowledge (including definitions, causes, terminology/rainfall types, protective actions) than emergency management. | Causes of flash flooding Definitions of flash flood Difference between heavy and intense rainfall Protective actions |
Partially supported Partially supported Not supported Supported |
| H4 | Public have lower perceptions of how likely various impacts are during a flash flood than emergency management. | Knowledge of flash flood effects | Not supported |
| H5 | Interpretations of the uncertainty and rainfall terminology used in forecasts and warnings varies | Terminology - uncertainty communication comprehension | Supported |
Flash flood knowledge
Hypothesis H1 was not supported. The absence of statistically significant differences in participant assessments of flash flood forecast difficulty suggests a consistent understanding between emergency management and the public regarding the general predictability of such events. While we expected that emergency management participants would perceive flash floods as being difficult to forecast, the public respondents shared this perception. This suggests that across both cohorts, perceptions align accurately with realities around the difficulty in predicting flash flood events.
Participants rated the importance of various flash flood risk factors. Overall, knowledge of environmental and situational factors contributing to flash flood risk was incomplete. While most participants recognised the importance of recent rainfall, fewer identified other critical factors such as land use or antecedent conditions.
Participants commonly associated recent rainfall (previous 24 hours) with flash flood risk but were less likely to consider longer-term rainfall accumulation (e.g. over the past month). Urbanisation was rated as ‘very’ to ‘extremely’ important by 63% of participants, potentially reflecting learnt experience. However, this may highlight a gap in public education for people in high-risk areas with limited exposure to flash floods. Hypothesis H2 was supported in that emergency management participants rated certain risk factors as more important, indicating a potentially deeper awareness of the influence of local conditions on flash flood risk.
Hypothesis H3 was partially supported. There were no significant differences in assessed generalised flash flood knowledge between the public and emergency management groups. The hypothesis that the public and emergency management groups would have different levels of knowledge of the definition and causes of flash flood and rainfall terminology was partially supported. Participants mostly defined flash flooding as 'flooding of short duration and relatively high flow'. Knowledge of the causes of flash flooding varied and over 67% of participants considered that storm surge or king tides could cause flash floods. Only about one-third correctly identified that flash flooding can occur within 6 hours of rainfall onset and 63% incorrectly believed that ‘intense rainfall’ always occurs over a shorter period than ‘heavy rainfall’. This is not true in general as the distinction between the terms, as defined by the Bureau, is driven by the amount of rain in a given time period, determined by the Annual Exceedance Probability (AEP). For severe weather and very dangerous storms, these thresholds are above 10% AEP depth for heavy rainfall and above 2% AEP depth for intense rainfall, both over a given period between 30 minutes and 6 hours (BOM 2025).
Misunderstandings of forecast terminology, such as this distinction between 'heavy' and 'intense' rainfall, were evident for both groups, supporting research that suggests technical terminology in warnings can be confusing (Box et al. 2016; Greer et al. 2020; Mehta et al. 2022). Good risk communication and warning practices suggest that simple language, no jargon and minimal use of well-explained technical information, is preferable to enhance comprehension (Greer et al. 2020; Kuligowski et al. 2024; Olson and Sutton 2025). Visual information or infographics may help to explain complex and technical concepts (Greer et al. 2020). Future studies could explore the use of language, visuals and message design to aid comprehension and personalisation of risk in Australian contexts.
In support of hypothesis H3, knowledge of appropriate protective actions and the effects of flash floods were generally higher among emergency management participants. Risk perceptions around potential effects and consequences were also mixed, with hypothesis H4 not supported. While transport disruptions were widely seen as likely, few participants perceived human injury or death as probable outcomes, mirroring results in the USA (Morss et al. 2016). Perceptions of a lower likelihood of fatalities may be related to lower intentions to take protective actions (Morss et al. 2016). This suggests a potential under-estimation of personal risk and highlights directions for future research.
Over 94% of participants knew to avoid waterways and low-lying areas. Although most respondents claimed to know what to do in response to a flash flood warning (perceived knowledge), only 30% of the public and 40% of emergency management participants correctly identified all appropriate protective actions (assessed knowledge). This finding supports other studies that people may overestimate their knowledge levels, placing themselves at greater risk (Casteel 2023; Lichtenstein and Fischhoff 1977; Nunley and Sherman-Morris 2020). Future studies could investigate, in Australian weather hazard contexts, if this overconfidence puts people at greater risk (Klein et al. 2017; Lichtenstein and Fischhoff 1977). Notably, 17% of participants indicated they would ‘wait for more information’, a potentially dangerous delay given the short lead times typical of flash flood events. This finding indicated the need for further research into decision-making under time pressures and the influence of public messaging on response.
Compared to the public group, emergency management participants had higher perceived knowledge, (slightly) more assessed knowledge and higher confidence in the accuracy of their assessed knowledge. These results are consistent with the literature on expertise and decision-making proficiency (Lichtenstein and Fischhoff 1977; Klein et al. 2017; Klein 2015). Professional weather forecasters and emergency managers are more confident in their knowledge and able to more accurately judge their specialist knowledge levels and are more likely to make better or more proficient decisions within their areas of expertise (Klein et al. 2017).
These findings provide guidance on future directions for research, education and engagement. A focus on increasing emergency management and public understanding of flash flood and related warning messages should be tempered by the knowledge of the important role of other factors on decision-making and response. Reliance on objective or assessed measures of knowledge that leads to a knowledge deficit approach to risk and science communication have their limitations (Simis et al. 2016; Olson and Sutton 2025). How people view or characterise the 'public' and attitudes towards social sciences can also perpetuate knowledge deficit models and communication and engagement challenges (Simis et al. 2016). Knowledge deficit models can lead to incorrect assumptions such as that education about technical terms will lead to direct behavioural change (Olsonand Sutton 2025). Furthermore, warning messages should be written with the assumption that recipients have no hazard knowledge (Greer et al. 2020). Response to warning information is complex and decision-maker contexts, environmental cues, social, behavioural, political and cultural factors influence message interpretation and response (Lazrus et al. 2016; Mulder et al. 2019; Paton 2019).
Although this study showed differences in knowledge between the public and emergency management groups, these should not be overplayed. The emergency management sector is highly diverse and includes a range of salaried staff and volunteer roles with different expertise and knowledge. Recognition of this diversity in emergency management and the public underscores the need to avoid assumptions about knowledge to ensure that communication is fit-for-purpose for intended audiences.
Communication of uncertainty terminology and interpretation of warning messages
For hypothesis H5, participants reported a range of values for the likelihood (per cent chance) of heavy rainfall or flash flood occurring. Results show statistically significant differences in the likelihood values they assigned depending on the wording used in the warning ('likely' and 'possible') and the hazard event type ( 'heavy rainfall' vs. 'flash flooding') (see Figure 14). This suggests that these terms and heavy rainfall warnings are interpreted differently. Findings align with previous research showing that verbal probability terms are inherently 'fuzzy' and context-dependent (Teigen 2023; Doyle et al. 2019; Patt and Schrag 2003). This discrepancy exposes a critical gap in how uncertainty is communicated and understood.
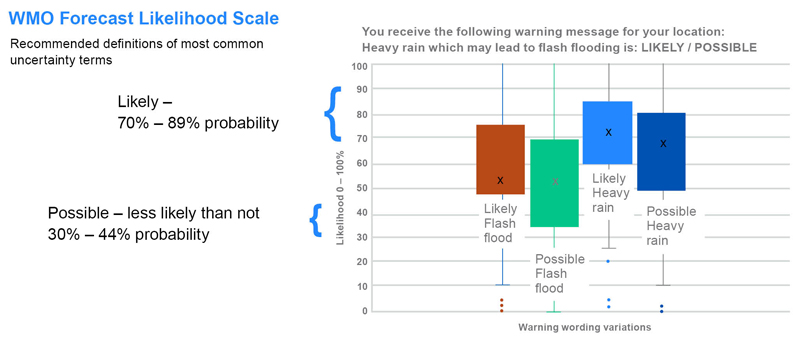
Figure 14: Box plots of the survey responses show a wide spread in perceived likelihood. Values range from 0% to 100% for the terms 'likely' and 'possible'.
The study highlights a mismatch between community interpretations and widely recommended definitions of key terms. For example, the World Meteorological Organization (WMO 2008) recommends using 'likely' to describe events with a 70–89% chance of occurring and 'possible' for probabilities between 30–44%. In contrast, the Common Alerting Protocol (CAP) (OASIS 2010) considers certainty and defines 'likely' as exceeding approximately 50% probability and 'possible' as falling below that threshold. Although participants generally perceived 'likely' as conveying greater certainty than 'possible', their interpretations showed significant overlap between the 2 terms, underscoring the ambiguity in understanding. Responses did not align with the standards set by either WMO or CAP. Importantly, there is no universal standard for verbal probabilities or phrases, and the associated likelihoods vary across organisations, countries, disciplines and domains (Teigen 2023; Ho et al. 2015; Doyle et al. 2019). Guidance often lacks practical advice for practitioners, including how to communicate uncertainty to decision-makers, when such communication is appropriate, and how context may influence these interactions (Doyle et al. 2019). To overcome these challenges in communicating uncertainty and to better support decision-making, further research and participatory approaches are needed to facilitate 2-way dialogue and engagement within emergency management agencies and communities (Doyle et al. 2019; Kirchhoff et al. 2013). This includes understanding the varied needs for uncertainty information and developing defined, standardised and decision-relevant uncertainty terminologies, language and typologies for Australian contexts (Doyle et al. 2019).
Previous research, including examination of Bureau surveys by Handmer and Proudley (2007), suggest that the public in Australia does understand the functional use of numerical probability statements in weather forecasts. However, confusion arises regarding the interpretation of these probabilities, such as a '30% chance of rain', particularly in relation to the likelihood, timing and location of a specific event. Ambiguity exists around verbal descriptor terms such as 'fine' and a lack of shared understanding between forecasters and the public was reported (Handmer and Proudley 2007). Despite these challenges, research suggests that people make better decisions when uncertainty information is included rather than omitted (Han and Joslyn 2025; Joslyn and Savelli 2021; Ripberger et al. 2022). It should be noted that how uncertainty is visually communicated in a forecast can influence comprehension and resultant decisions (Clive et al. 2023; Joslyn and Savelli 2021; Stephens et al. 2019). Research in the USA shows that the public prefers that numbers and phrases are used together to communicate weather information and may perceive forecasts as more reliable when numeric probabilities are included (Rosen et al. 2021; Burgeno and Joslyn 2023). The communication of uncertainty is important to the successful mitigation of risk and public safety (Doyle et al. 2019; National Research Council 2006; WMO 2008).
Implications of inadequate communication of uncertainty in warnings
Uncertainty is a dynamic and complex concept and people vary in how they define or deal with it (Doyle et al. 2019, 2023; Lipshitz and Strauss 1997; Morss et al. 2005). Uncertainty plays a critical role in shaping risk perception, decision-making and preparedness (Carr et al. 2016; Lipshitz and Strauss 1997; Doyle et al. 2019). From the perspective of natural hazards and the communication of scientific information, there are 3 sources of uncertainty: the data, the actors and the known and unknown unknowns (Doyle et al. 2023). For example, uncertainty about forecasts, such as the expected height of floodwaters or the timing of an event, can influence public and emergency management behaviour, complicating decision-making, planning and emergency response (Doyle et al. 2023; Haynes et al. 2018; Waring et al. 2020). Conflicting information in warning messages, contradictory environmental cues and forecast inconsistency or inaccuracy may also create increased uncertainty, making it harder for people to act decisively (Dootson et al. 2022; Joslyn and LeClerc 2013; Su et al. 2021). In the context of flood risk management, there are numerous additional sources of uncertainty in estimating flood risk (Morss et al. 2005; WMO 2012). Decision-makers may need to cope with 3 types of uncertainty: ‘inadequate understanding’, ‘undifferentiated alternatives’ and a ‘lack of (or incomplete) information’ (Lipshitz and Strauss 1997, p.158). Some sources of uncertainty may be assessed and reduced through, for example, collecting more information or changing plans, while others may be unavoidable or not relevant to a decision-maker (Morss et al. 2005; Lipshitz and Strauss 1997; Orasanu et al. 2004).
In weather forecasts and warnings, uncertainty is inherent and often expected by decision-makers (Joslyn and Savelli 2010; Savelli and Joslyn 2012; Greer et al. 2020). Lipshitz and Strauss (1997) express uncertainty as a sense of doubt that blocks or delays action. Uncertainty about a situation can lead to delayed decisions and poor outcomes, especially when individuals have poor situation awareness, engage in maladaptive coping activities or behaviours such as 'milling' (looking for further information or confirmation) (Lipshitz and Strauss 1997; Waring et al. 2020; Wood et al. 2018). However, research suggests that the inclusion of numeric uncertainty estimates (probability information) increases trust in the forecast, provides relevant information to decision-makers and helps overcome negative effects of forecast inconsistency and inaccuracy leading to increased certainty, improved decision quality (better decisions) and greater caution (Burgeno and Joslyn 2023; Han and Joslyn 2025; Su et al. 2021; Ripberger et al. 2022). Future research could examine verbal probability terms, use of numerical probabilities with verbal probabilities, visual communication of uncertainty and the use of defined probability ranges to see if they are understood as intended. This work could examine if improved communication of uncertainty in warnings leads to efficient and informed decisions that enable timely actions that reduce risk.
Limitations
A snowball sampling method was used meaning that the sample was not representative of the Australian population. As such, the findings are less generalisable and the limited demographic information available from the survey data makes it difficult to examine group differences beyond the binary of public or emergency management. There is no data related to age, sex/gender or psychological, social or economic factors that may influence flash flood knowledge, perceptions or response to warnings. The research literature shows that psycho-social factors are important to effective risk communication. Future research could consider these factors.
The scales used in this study were developed as a part of exploratory research. The perceived knowledge, importance of flash flood risk factors and knowledge of flash flood effects scales showed good reliability. However, after analysis, further refinement and testing of the assessed knowledge questions is recommended due to the low scores. These questions may have been confounded or confusing to participants.
Past flood experience can influence preparedness and warning response (Box et al. 2016; Morss et al. 2016). Over half of the participants had some form of flood experience, highlighting the need for further research to improve understanding of how past hazard experiences influence risk awareness, warning reception, comprehension, response and proactive and maladaptive behaviours in Australian contexts, particularly if flood events are becoming more frequent or extreme. Future research could examine what past flood experience entails to develop a nuanced and explicit understanding (Demuth 2018). It is important to account for individual differences as these can shape how people perceive and assess risk and uncertainty, influence their behaviour and preparedness and affect how they respond to warnings and take protective action (Dallo et al. 2022; Demuth 2018; Doyle et al. 2019; Paton 2019).
This study focused on testing text versions of heavy rainfall warnings. Future research could explore how visual elements and numerical probabilities affect people's interpretation of uncertainty information. It would also be useful to investigate the qualitative interpretation of terms such as 'likely' and 'possible' and examine the language used in warnings and forecasts (e.g. Olson and Sutton 2025) and how these affect decision quality.
Conclusion
Findings and recommendations from this research will help frame how future services and products can be developed to improve risk and uncertainty communication during flash flood events. In operations, applying good-practice recommendations for warning communication, such as using simpler language, clarifying and explaining technical terms and standardising and using numerical and verbal expressions of uncertainty or probability together could have immediate benefits and improve the communication of risk and uncertainty.
These findings highlight several areas where targeted education and professional development are needed. Improving public understanding of flash flood definitions, risk factors and appropriate responses, especially in high-risk or newly urbanised areas, could enhance resilience and reduce response delays during critical events.
The use of verbal probability terms in weather warnings may not effectively convey intended levels of risk and certainty. Participant interpretations of 'likely' and 'possible' varied widely and often did not match official definitions. These findings highlight the need for clearer, standardised communication of forecast uncertainty and targeted public education to improve understanding and response to severe weather events and warnings.