Change in natural and human systems are almost invariably measured using trends. Cause and effect are known to take other forms but these are rarely investigated and, if they are, the burden of proof tends to be greater. When dealing with complex systems, analysts (and their critics) need to be more discriminating.
Flood deaths in Australia 1900–2015 were investigated by Haynes et al. (2017)1 using the PerilAUS database constructed by Risk Frontiers2 using a methodology also applied to bushfire fatalities (Haynes et al. 2010).3 This was combined with coronial information to determine causes of death and develop potential policy interventions. A total of 1,859 flood deaths occurred during 1900–2015. About two-thirds of these deaths involved 2 or fewer people and most were due to drowning or suspected drowning. People of indigenous heritage are likely to be underrepresented in the data, especially earlier in the 20th Century (Haynes et al. 2010).
Between 1900 and 1960, the rate of deaths due to floods declined by 0.55 persons per 100,000 population per year, but a step change occurred around 1960 to lower mortality levels that have since remained stable. Numbers declined from 219 deaths per decade before 1960 to 99 per decade afterwards. Work by Haynes et al. (2017) determined a reason for this rapid decline, speculating that it may have been due to flood mitigation works, technology advancements, better warnings and the postwar expansion of emergency services response (i.e. the growth of the SES). However, records of state-based SES show staggered starts, with Queensland, the state with the most deaths, having no specific emergency response function until the early 1970s.
In 1957, the Australian Government directed the Bureau of Meteorology to set up a hydrology branch that subsequently operated in Queensland, New South Wales and Victoria (Pagano et al. 2016)4, the states where most deaths had occurred during recent major floods in Australia’s east coast. The early warning system used provided forecasts of river heights and their timing to local newspapers and radio. This advance information cut the fatality rate by over half. Such a dramatic effect—halving the death rate—demonstrated the economic value of early warning systems. No other innovation before or since has had a similar result.
Haynes et al. (2017) suggested that vehicle-related mortality (driver or passenger in a motorised vehicle) showed an increasing trend to 1960, after which it declined, but the data show an increasing trend until 1979 (52 deaths in 1970–1979). Since then, mortality has been between 15–18 people per decade to 2010. The peak mortality in the large floods that occurred in the mid-1970s may have prompted subsequent public warnings that were heeded. Between 1980 and 2010, death rates remained constant, perhaps related to increases in car ownership and population. Following a decade of drought, widespread and flash flooding in the eastern states saw mortality during flood rise again during 2010–2011.
Coates (2022)5 updated flood mortalities for the year to April 2022, comparing them to the previous decade. Forty-one deaths were registered, compared to 48 during 2010–2011. Of the top 10 years with the most fatalities, the only other post-1957 date was 42 deaths during 1973–1974. Despite improvements in early warning systems and targeted communications, mortality rates in the 2021–22 floods were also accompanied by widespread injury and property damage and loss.
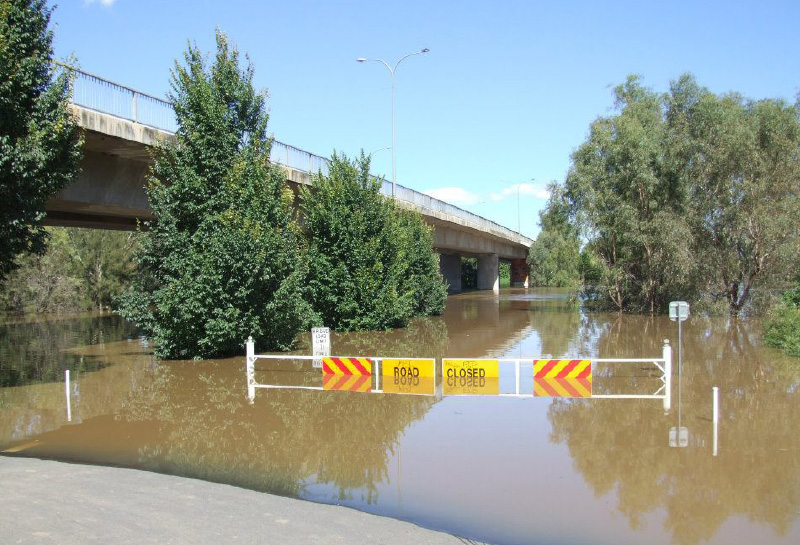
Australia's early warning system provided forecasts of river heights and their timing to help residents prepare.
Image: NSW Rural Fire Service
The identification and establishment of the Bureau of Meteorology Hydrology Branch contributed to a reduction in deaths due to floods and is an example of the value in undertaking nonlinear hazard analysis. Regime shifts (the rapid change from one steady state to another) can occur in both natural and human systems. The introduction of early warning is an example of the latter. Looking at natural systems, rainfall in Australia underwent a regime shift in 1972 increasing by 12% at p<0.01, mainly driven by a regime shift in the northern Australian summer rainfall of 16% at p<0.01. This was closely followed by a shift of 0.32°C in average annual sea surface temperature Australia wide that extended upwards into the western Pacific Ocean warm pool. Warmer oceans allow airmasses to hold more moisture. The 3 most recent flood-mortality events in 1974, 2011 and 2022 occurred during La Niña events, carrying water of tropical origin, fuelled by a warmer climate.
These external drivers of flood risk may be combining with historical legacies, such as settlement patterns and floodplain modification to overwhelm warning and response systems, creating long-term legacies for recovery. Such changes are generally not amenable to trend analysis, as they only tend to emerge above statistical ‘noise’ at some time after the change has occurred. This increases the risk of failing to anticipate change and locking in future losses. These types of changes need to be assessed and, if present, factored into the relevant areas of strategic natural hazard risk management.
Endnotes
1. Haynes K, Coates L, van den Honert R, Gissing A, Bird D, de Oliveira F, Darcy R, Smith C & Radford D 2017, Exploring the circumstances surrounding flood fatalities in Australia—1900–2015 and the implications for policy and practice. Environmental Science and Policy, vol. 76, pp.165–176.
2. Risk Frontiers, at https://riskfrontiers.com/.
3. Haynes K, Handmer J, McAneney J, Tibbits A & Coates L 2010, Australian bushfire fatalities 1900–2008: exploring trends in relation to the 'prepare, stay and defend or leave early' policy. Environmental Science and Policy, vol. 13, no. 3, pp.185–194.
4. Pagano T, Elliott J, Anderson B & Perkins J 2016, Australian Bureau of Meteorology Flood Forecasting and Warning. In T. Adams and T. Pagano (Eds.), Flood Forecasting: A Global Perspective, pp.3–40. Academic Press, London.
5. Coates L 2022, A flood of rain events: how does it stack up with the previous decade? Briefing Notes, Risk Frontiers, Macquarie Park NSW.