Tropical Cyclone Vance struck Exmouth on the Western Australia coast on 22 March 1999 causing widespread damage. What would happen if a similar cyclone struck the area in 2019?
Severe Tropical Cyclone Vance is one of the most intense cyclones to make landfall in Australia. The cyclone formed near Darwin on 18 March 1999 and intensified to a Category 5 system (maximum wind gusts greater than 285 km per hour) as it turned towards the Western Australia coast (Figure 1). Tropical Cyclone Vance crossed the Exmouth Gulf on the morning of 22 March 1999 at Category 5 cyclone intensity. Learmonth Airport recorded a maximum wind gust of 267 km per hour, which remains the highest wind gust recorded on mainland Australia.
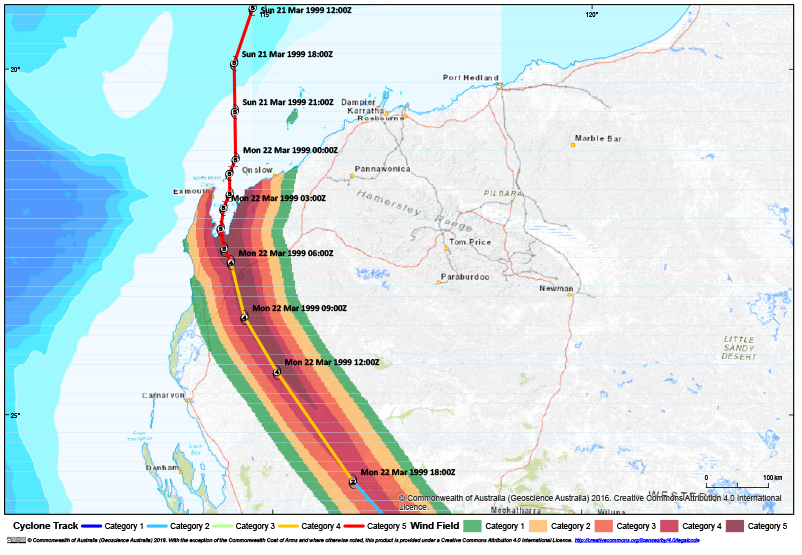
Figure 1: Estimated maximum gust wind speeds from Tropical Cyclone Vance, based on the best track provided by the Bureau of Meteorology. Source: B. Santos 2018, pers. comm
Damage experienced
Boughton (1999)1 provided a comprehensive analysis of the damage that occurred in the wake of the cyclone as summarised in Table 1. The observed damage was explained in terms of structural performance of the buildings. The greatest damage was sustained by transportable homes that had been in place for over 15 years. More than 20 per cent of buildings surveyed suffered major structural damage.
Table 1: Damage state by house type following Tropical Cyclone Vance.
| Damage state | Trans-portable more than 15 years* | Trans- portable less than 15 years* | Housing Commission* | Dravo* | US Navy block house* | Brick/ masonry* | Other less than 15 years |
| Major structural | 22% | 0% | 5% | 2% | 0% | 1% | 0% |
| Minor structural | 25% | 5% | 8% | 6% | 0% | 3% | 10% |
| Non-structural | 3% | 37% | 17% | 2% | 0% | 28% | 20% |
| No damage | 50% | 58% | 70% | 90% | 100% | 68% | 70% |
Source: Boughton 1999. *House type as defined in Boughton 1999.
Simulating local winds in Exmouth
In 2019, the wind field from Tropical Cyclone Vance was simulated using the Geoscience Australia parametric tropical cyclone wind model that incorporates local influences of topography (hills and ridges), vegetation and surrounding buildings (Figure 2). Because of these effects, most of Exmouth would experience winds typical of Category 3 cyclone intensity (maximum gusts to 225 km per hour). Some areas in the centre of town may only experience wind gusts of up to 160 km per hour, while houses on the edge of town and near the marina may experience gusts in excess of 225 km per hour. In the simulation, maximum winds at Learmonth Airport (25 km south of Exmouth) peaked at 270 km per hour, just short of Category 5 intensity on the western shore of Exmouth Gulf and very close to the recorded peak of 267 km per hour.
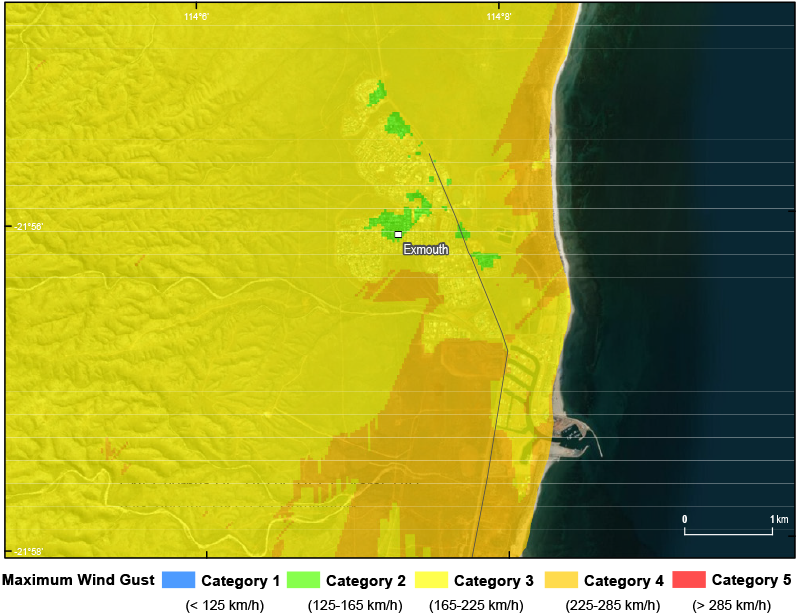
Figure 2: Localised maximum wind speeds from a simulation of Tropical Cyclone Vance in present-day Exmouth, Western Australia.
Residential buildings in Exmouth today
Modern residential houses in Exmouth were built after the mid-1980s and are designed to survive extremely high wind loads. Houses are expected to remain serviceable when winds exceed 300 km per hour. Older houses, built prior to the implementation of revised building codes in the 1980s, are significantly more vulnerable to high winds. However, the concrete block houses the U.S. Navy built in the 1960s, of which there are around 120 in the town, are incredibly resilient and would suffer virtually no structural damage, even when wind gusts exceed 300 km per hour.
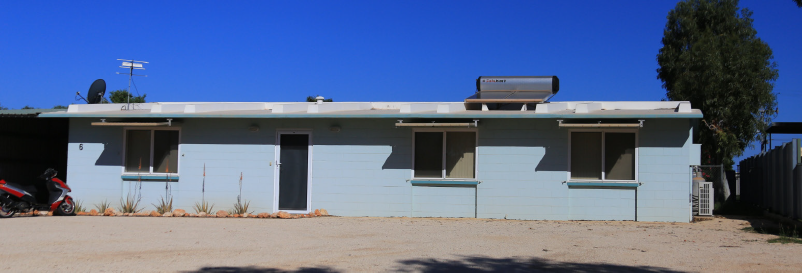
Typical U.S. Navy block house. Image: Craig Arthur
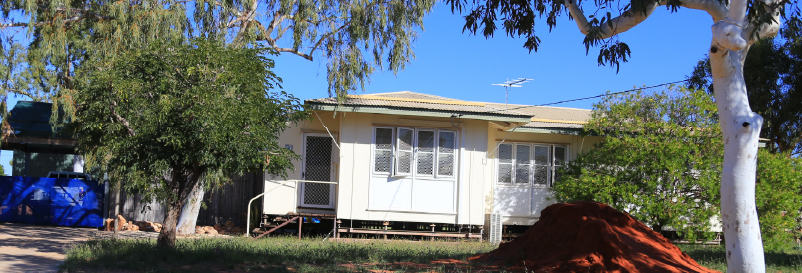
1960s-era fibro house in Exmouth. Image: Craig Arthur
Damage to present-day residential houses
Combining the structural vulnerability of housing with an estimate of the maximum wind gusts, the possible destruction that a repeat of Tropical Cyclone Vance would cause in Exmouth can be explored and the outcomes compared with what occurred in 1999. When considering the vulnerability of houses, building classifications are generalised to construction era (aside from the U.S. Navy block houses) (Table 2).
| Damage state | Pre-1980s | US Navy block houses | Brick/masonry | Post-1980s |
| Complete | 0% | 0% | 1% | 0% |
| Extensive | 1% | 0% | 4% | 1% |
| Moderate | 25% | 0% | 2% | 4% |
| Slight | 70% | 0% | 27% | 30% |
| Negligible | 4% | 100% | 66% | 65% |
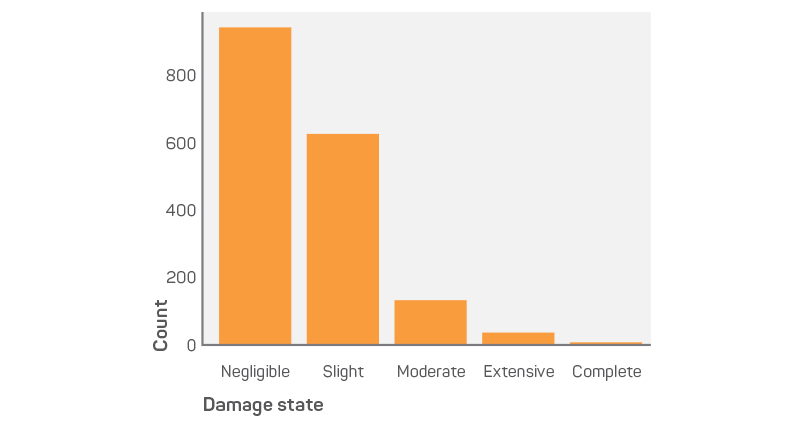
If similar winds experienced during Tropical Cyclone Vance occurred today, the overall damage across present-day Exmouth would be lower compared to the effects observed in 1999 (Figure 3). Two key factors contribute to this outcome:
- The number of houses in Exmouth has grown by at least 25 per cent since 1999, all of which would be designed to modern construction codes.
- The houses destroyed and rebuilt in 1999 have been replaced using modern, code-compliant construction.
The analysis of the impacts of Tropical Cyclone Vance on present-day Exmouth showed that very few houses would be completely destroyed. Not surprisingly, older houses (pre-1980s, excluding the U.S. Navy block houses) would dominate those destroyed. Of equal vulnerability would be the timber-framed houses, many of which were substantially damaged during Tropical Cyclone Vance.
Summary
Tropical Cyclone Vance was the most intense cyclone to make landfall in mainland Australia in several decades. The damage inflicted in Exmouth was significant and memories of the event still remain with residents who endured the storm.
It should not be forgotten that Tropical Cyclone Vance did not exceed design wind loads and that more intense cyclones could occur. The highest recorded wind speed in the world is 408 km per hour during Tropical Cyclone Olivia in 1996 at Barrow Island in Western Australia. These wind speeds could destroy even heavily engineered buildings.
The Western Australia Department of Fire and Emergency Services is exploring potential catastrophic scenarios to improve its understanding of the possible consequences. This will help the department reduce the impacts on communities and infrastructure and respond and recover from such events.
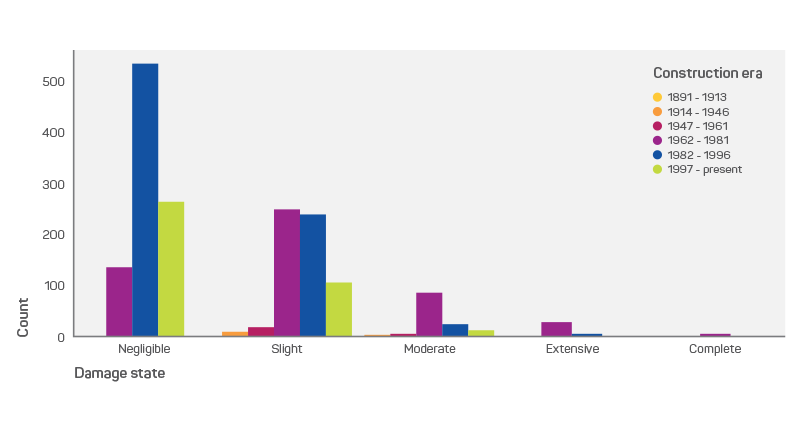
Figure 3.1: Damage state by construction era.
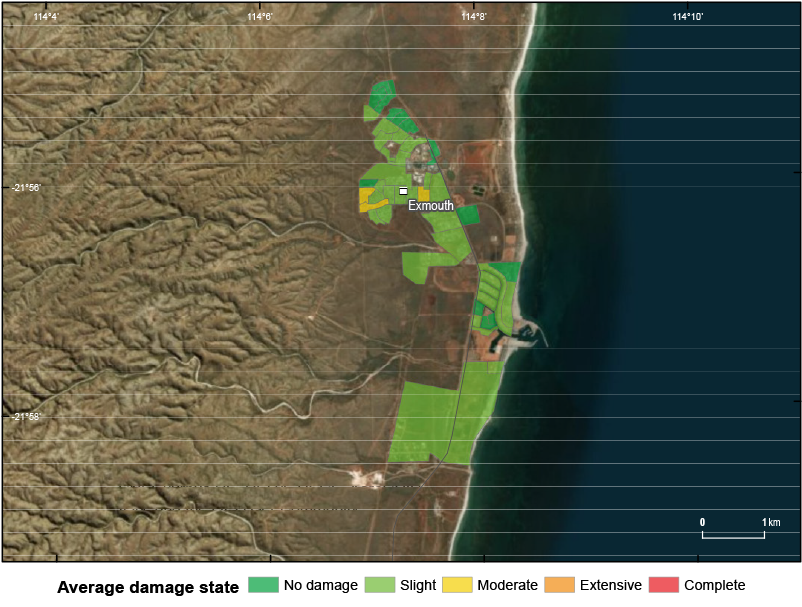
Figure 3.2: Damage classification for present-day Exmouth.