There is greater competition for funding within the public sector and, combined with the increasing scope of high-risk hazards that emergency services personnel are responsible for is placing greater economic pressure on emergency services worldwide. With this pressure comes additional requirements to justify expenditure and effort across operational and corporate contexts, including the training of career and volunteer personnel to the necessary level of contemporary multi-hazard expertise. Within this context, Australasian fire and emergency services must submit formalised cases for funding through state or Commonwealth treasury departments, in most cases competing with other government departments for limited funding. These are usually assessed based on public and political value and benefit. The investment in new, high-fidelity practical and simulated training environments, let alone a new training academy or college, is expensive and has the potential to be one of the largest capital projects emergency services can undertake. Justifying the cost of new training environments is complex due to the difficulty of translating the technicalities of specialised emergency response into corporate language and because of the lack of data and literature on which to draw guidance. This paper bridges this knowledge gap by building on existing models and research to propose an Emergency Services Training Financial Rationalisation Model (EST-FRM) for the funding of emergency services academies in Australia. The model has potential application wherever financial rationalisation of emergency services facilities is required.
Introduction
In Australia, fire and emergency services are legislatively responsible within their respective jurisdictions for the prevention, preparation, response and recovery of high-risk hazards and disasters. In a country as large as Australia, this includes centralised fire and emergency services training facilities and headquarters supporting geographically diverse urban and regional operations and response. The annual financial cost of disasters to society is significant, currently costing the Australian economy $38 billion per year and this is expected to rise to $73 to $94 billion by 2060 (Deloitte Access Economics 2020). As these events become more complex and far-reaching due to increasing urbanisation and climate change, emergency management (the organisation, command, control and coordination of resources and responsibilities during a crisis) and the ability to make critical decisions with limited information in time poor environments is essential (Penney et al. 2022; Patterson et al. 2009; Nja & Rake 2009; Curnin, Brooks & Owen 2020; Launder & Perry 2014).
The failure of the decision-making process required in high-impact disasters produces the most severe consequences and can significantly lengthen and increase the socio-economic burden to society (Tuhkanen, Rosemarin & Han 2017). To mitigate the consequences of poor decisions, development of training that exposes emergency managers and responders to a wide range of high-risk scenarios coupled with the spectrum of decision-making processes common across the services that form multi-agency incident management teams is required (Penney et al. 2022, Launder & Perry 2014, Cohen-Hatton & Honey 2015).
By understanding the tendency of humans to default to heuristics (simple strategies used to approximate or estimate the best outcome from a decision when time or processing capability is limited), training can be designed and applied to ensure the most high-risk decisions (those with highest affect that provide no discretionary time to research the best course of action) can be addressed in the most effective way. To achieve this, hyper-realistic and immersive simulation training environments combined with exposure to and practice of a range of decision-making models is required (Popper 2019, Patterson et al. 2009). Hyper-realistic training environments are defined as ‘having a high degree of fidelity in the replication of battlefield conditions in a training environment, so participants willingly suspend disbelief that they become totally immersed and eventually stress inoculated in a way that can be measured physiologically’ (Hoang et al. 2020, p.1).
While it is foreseeable that all emergency services personnel will have at least a base level of training capability, to achieve this level of high-fidelity realism within fire and emergency training facilities requires significant investment for all aspects of the project, regardless of jurisdiction. This is particularly the case in services that cater for incident response and emergency management of a comprehensive range of hazards. For example, the Civil Defence Academy in Singapore (which has reciprocal training relationships with fire services throughout Australia) was established at a cost of $96 million in 1999 (Singapore Civil Defence Force 2020), equating to approximately AUD $165 million in 2022. By comparison, the Victorian Emergency Management Training Centre, completed in 2014, required an investment of $109 million (Curtin 2017), equating to approximately AUD $121 million in 2022. The investment in new training environments, let alone a new training academy, is one of the largest capital projects an emergency services organisation can undertake.
In Australia, most emergency services organisations including fire services and policing are responsible for the provision of the entirety of training required. Unlike professions including teaching or nursing or trades, there are limited options available to use private or external training providers. Also, different types of facilities and resources are required to address a broad range of training needs. For example, most of the fire and emergency services require training facilities that can facilitate ‘hands on’ technical and practical training including simulated urban environments, hot (live) fire simulation facilities, classrooms or lecture rooms and, increasingly, complex simulation suites for incident management training. Further, emerging risks and hazards including electric, hydrogen or fuel cell powered vehicles and battery storage systems may require the development of new types of training props or facilities.
Planning to meet the future training needs of emergency services over the lifetime of a facility is a specialised process. Justifying the cost of new training programs, technologies, an academy or a centralised facility supporting regional training through a hub-and-spoke model or similar, can be equally as difficult. This is due to the complexities of translating the technicalities of specialised emergency response into corporate language and because of the dearth of data and literature on which to draw guidance. The lack of existing data, coupled with the distinct differences between emergency services and other public services makes the use of traditional public-value assessment and cost-benefit analysis problematic.
This paper considers this knowledge gap by proposing a defendable cost-benefit analysis model for financial rationalisation of improvements in emergency services training that results in tangible improvements including safety, training programs, operational response and other community benefits. This model, termed the Emergency Services Training Financial Rationalisation Model (EST-FRM), builds on existing cost-benefit analysis methodologies as well as Swedish approaches (Jaldell 2004, 2017; Weinholt & Granberg 2015) to financially rationalise first responder initiatives. The model has potential application wherever financial rationalisation of emergency services training facilities is required, whether it be for entirely new facilities or for staged development and enhancement. Using a hypothetical case study for a new emergency management training facility, we demonstrate how the model can be applied as part of a comprehensive business or funding case.
Emergency Services Training Financial Rationalisation Model
When completing financial analysis of any major project or initiative, analysts consider the current state, in other words the baseline, against the proposed alternatives, modelled as economic changes that move society from the baseline towards a new state of equilibrium (National Center for Environmental Economics 2014). It provides quantitative guidance for decision-makers as to whether a project is worth the expense when it is not possible to perform market evaluations (Weinholt & Granberg 2015). A new training facility is typically a once-in-a-generation project where comparative market evaluations are not possible. The baseline is regarded as the current situation including any existing facilities. The new state of equilibrium is the new training facility. Adapted from Weinholt and Granberg (2015), this can be expressed as Equation 1. The primary improvement in the EST-FRM compared to existing methodologies is the inclusion of service utility (discussed in detail later), which facilitates the evidence-based calculation of the value of consumer benefits directly attributable to new, high-fidelity emergency management training centres.


Where W (the annual nominal societal economic value) is expressed as the sum of recurrent annual nominal government budgets (B), external effects (EE), service utility (SU), and producer surplus (PS) over a time period (t). The start of the project, considered to be when capital outlay occurs, is represented by t = 0.
Benefits are represented by positive numbers and costs are represented as negative amounts. For example, an increase in ongoing maintenance costs would be a negative figure in the equation, while a reduction in operating costs is considered a benefit and would be represented as a positive figure. In infrastructure projects such as new emergency management training facilities, most costs are incurred soon after the project is approved and the benefits are realised over decades (Deans 2018). Where the scientific basis for a well-established discipline is sound, a relatively small uncertainty factor (UF), also known as a safety factor, may be suitable (Penney, Habibi & Cattani 2020). Consistent with the approach of the Rural Urban Interface Model (RUIM) (Penney, Habibi & Cattani 2020), an uncertainty factor of 2 is initially applied to identified future benefits (i.e. those that aren’t realised at the onset of the project) to account for the uncertainty of predictions.
As the benefits and costs realised in the future are worth less than those enjoyed in the present (Department of the Prime Minister and Cabinet 2020), a discount rate (D) to future benefits must be applied. This is achieved by calculating the net present value (NPV) of the project, using Equation 2.
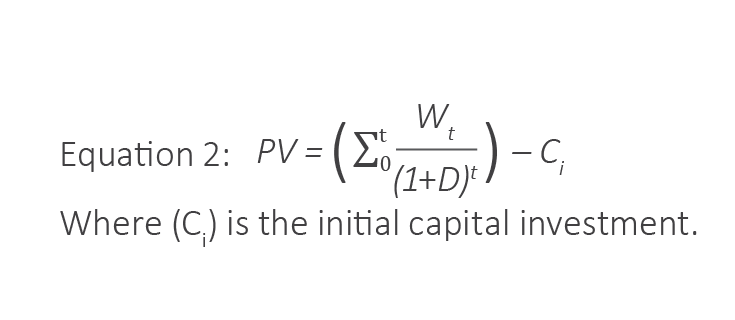
In Australia, the discount rate for capital infrastructure projects is 7%, with sensitivity analysis recommended at 3% and 10% where uncertainty is present (Department of the Prime Minister and Cabinet 2020). A positive Net Present Value (NPV) for the time period suggests an overall economic benefit for a new emergency management training facility. An NPV=0 represents the breakeven point for the project.
Government budgets (B) include the changes to recurrent operating costs of the proposed training facility including salaries, programs and maintenance. Positive values identify cost savings while negative values represent a financial cost to society.
Weinholt and Granberg (2015) suggest external effects (EE) may be assumed to equal zero as all individuals in society can be considered consumers of the responders produced by a new training academy. However, where the new training facility supports international emergency services capabilities, such as INSARAG Urban Search And Rescue teams that will be deployed for international disasters, benefit to international communities may be captured as an external effect.
Service utility (SU) is considered the improvement in emergency service performance attributable to the new facility and funded by the government expenditure. Historically, calculating these benefits and determining their attributability to a new facility has been problematic (Weinholt & Granberg 2015). The EST-FRM addresses this issue through the application of the Fire Brigade Intervention Model (Australasian Fire and Emergency Services Authorities Council 2020), the Rural Urban Interface Model (Penney, Habibi & Cattani 2020), research by Jaldell (2004, 2017) and Marks, He and Buckley (2018) as well as emergency services data.
Jaldell (2004) applied a risk-based linear model to calculate the dollar value per minute of damage caused by fires and other emergencies. Marks, He and Buckley (2018) reported the economic cost of business disruption and operational response in the context of false fire alarm response. The results have been contextualised for current Australian conditions and expanded to include response to other incident types. The FBIM enables the time taken to be calculated for firefighters to be alerted, respond and suppress fires, deal with hazardous materials incidents and conduct rescues in urbanised areas. The RUIM enables the same outputs to be calculated in the context of regional areas and the rural urban interface. Both the FBIM and RUIM incorporate percentiles into the calculations that allow for the varying levels of firefighter proficiency. It is incorporated into the EST-FRM to calculate existing and potential incident response timeframes once emergency responders have arrived at an incident.
In the context of emergency services, a new emergency management training facility that provides high-fidelity training may lead to improved operational practice, which in turn provides consumer benefits of higher survival rates and reduced damage costs (Tuhkanen, Rosemarin & Han 2017; Cohen-Hatton & Honey 2015; Hoang et al. 2020). This improvement is incorporated into the EST-FRM and allows annual nominal SU to be calculated, see Equation 3.
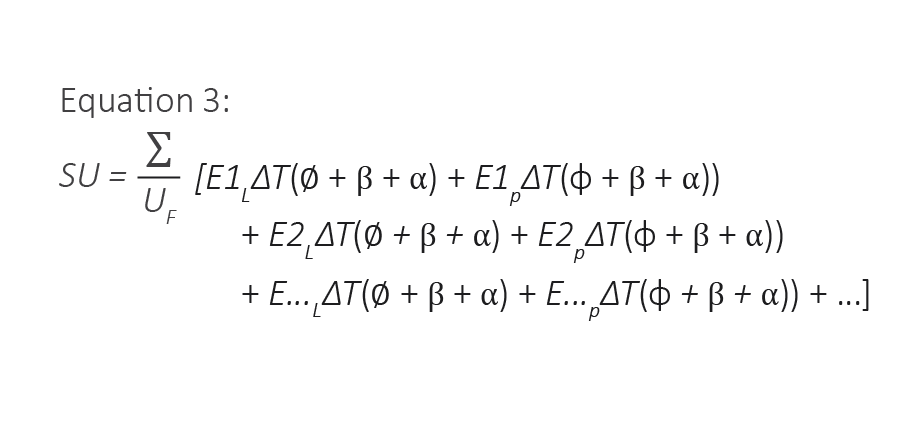
Where UF is the uncertainty factor applied to recurrent benefits; En is a discrete incident type, for example apartment fires, warehouse fires or traffic accidents; subscript L denotes incidents where property damage occurred and causalities were injured or killed; subscript P denotes incidents where property damage occurred without injuries or fatalities; ∅ is the value of property and life damage in AUD 2020 per minute, contextualised from Jaldell (2004) and detailed in Table 1; φ is the dollar value of property damage only in AUD 2020 per minute, contextualised from Jaldell (2004) and detailed in Table 2; β is business disruption; α is the operational cost of fire service emergency response and ∆T is the difference in incident duration in minutes.
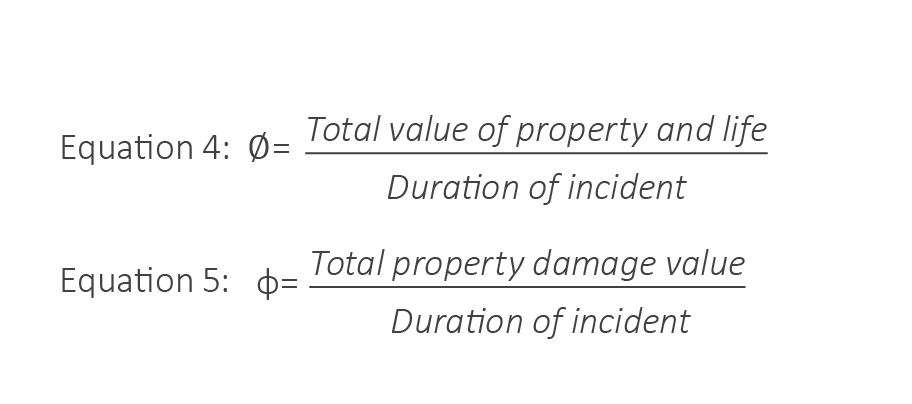
Using the values in Table 2 and supported by suitable fire service data (identifying the number of incidents involving casualties and those incidents resulting in property damage only) the statistical value of life and associated disability weightings (Department of the Prime Minister and Cabinet 2020), can be used to calculate both ∅ and φ using equations 4 and 5. The duration of the incidents (i.e. how long it takes from arrival of responders to making the incident safe to handover to local jurisdictions including business owners and local governments) can be determined from either available data or suitable models including the FBIM and RUIM.
The economic cost of both business disruption (β) and fire service operations (α) is sourced from research into fire service alarm calls (Marks, He & Buckley 2018). Fire service alarm calls with no actual fire present, where firefighters respond to a false alarm (burned toast, steam, construction, malfunction), result in significant disruption to workplaces as workers evacuate until firefighters confirm the false alarm and either isolate or reinstate fire alarm systems. The economic cost of this business disruption per incident has been reported by Marks, He and Buckley (2018) as $1,825 in 2014, equivalent to $2,024 in 2020. The cost of associated fire service response was reported as $3,651 in 2014, equivalent to $4,048 in 2020.
Table 1: Damage in dollars per minute in AUD 2020 (adjusted from Jaldell 2004).
| Incident type | ∅ ($) | φ ($) |
| Structure fire (average) | 6,201 | 5,455 |
| Structure fire (detached house) | 2,631 | 2,587 |
| Structure fire (apartment buildings) | 3,999 | 3,163 |
| Structure fire (medical facilities and hotels) | 2,417 | 1,979 |
| Structure fire (shops, schools and restaurants) | 24,746 | 21,923 |
| Structure fire (agriculture and farm buildings) | 9,503 | 9,226 |
| Structure fire (chemical industry) | 11,473 | 11,089 |
| Structure fire (other industry and warehouses) | 6,567 | 5,558 |
| Bushfire - productive forest | 527 | 527 |
| Bushfire - other | 219 | 219 |
| Traffic accident (average) | 3,851 | - |
| Traffic accident (road traffic) | 3,556 | - |
| Traffic accident (trains) | 23,129 | - |
| Traffic accident (aircraft) | 33,069 | - |
| Traffic accident (ship/boat) | 76 | - |
| Hazardous materials | 174 | - |
| Water damage | 49 | - |
| Storm damage | 11 | - |
Table 2: Property damage in dollars per incident in AUD 2020.
| Incident type | $ |
| Fire - residential1 | 36,480 |
| Fire – other than residential2 | 57,513 |
| Vehicle crash – fatal3 | 15,487 |
| Vehicle crash – serious3 | 12,941 |
| Vehicle crash – other3 | 12,770 |
| Vehicle crash – average3 | 13,733 |
1. Adjusted from Commonwealth of Australia (2016)
2. Adjusted from Association of British Insurers (2009) cited in Commonwealth of Australia (2016)
3. Adjusted from Australian Transport Assessment and Planning (2020)
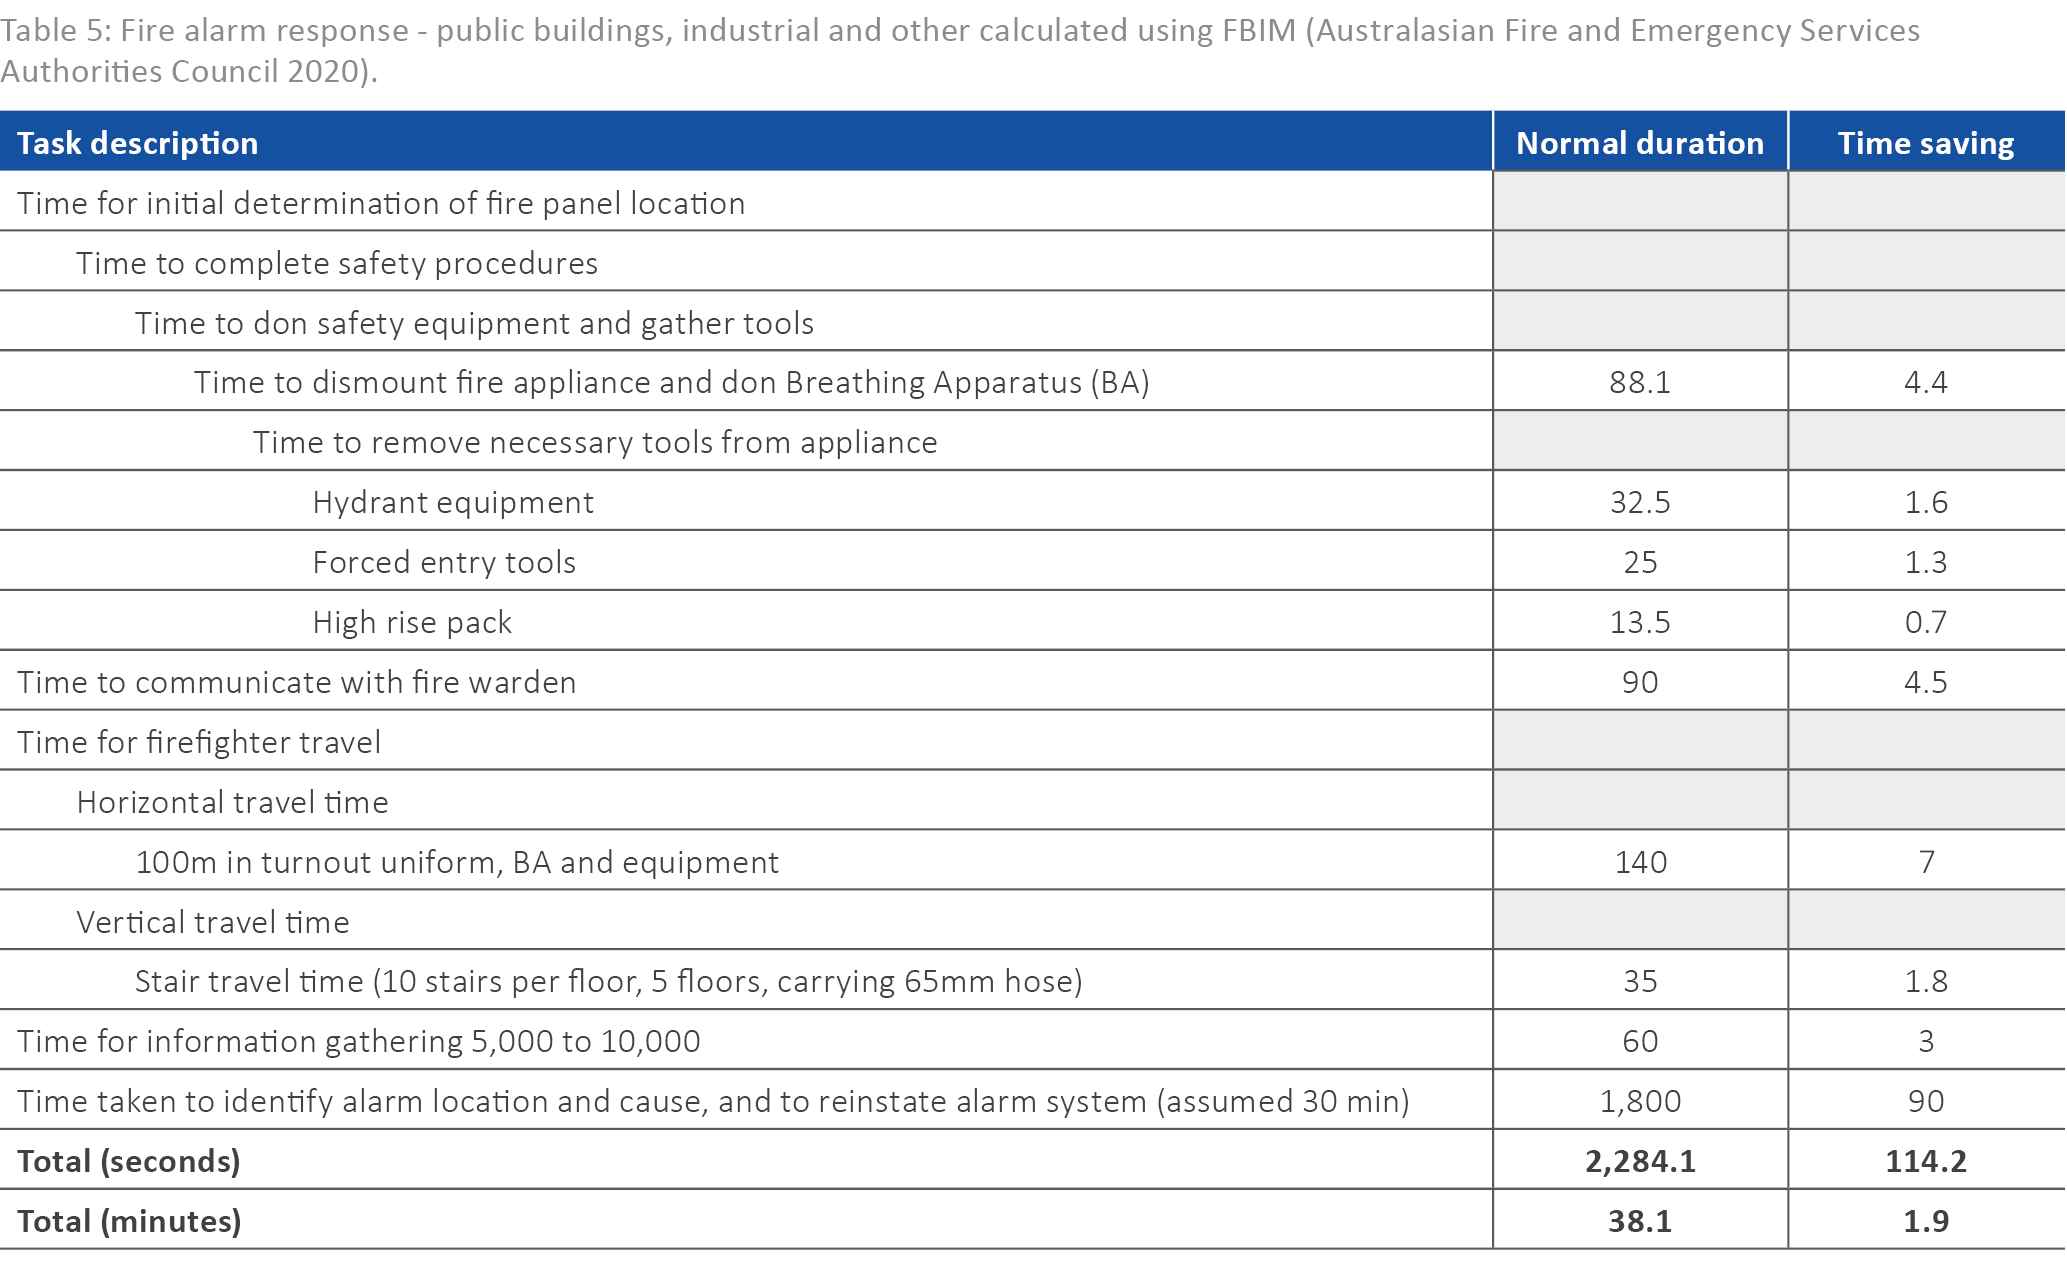
Economic costs of business disruption and service operations per minute is calculated using equations 6 and 7. While data pertaining to the business disruption due to storm, flood or road crash rescue response was not located during the development of this model, β may be calculated using available departmental or institutional data. The duration of the incident can be determined from either available data or the FBIM (as detailed in the case study). Using the example of a fire service alarm call (see Table 5) the calculated incident duration is 38 minutes, business disruption (β) is calculated at $53 per minute using Equation 6, and the cost of fire service operations (α) is $106 per minute calculated using Equation 7 (which can also be applied to other incident types in the absence of suitable data).
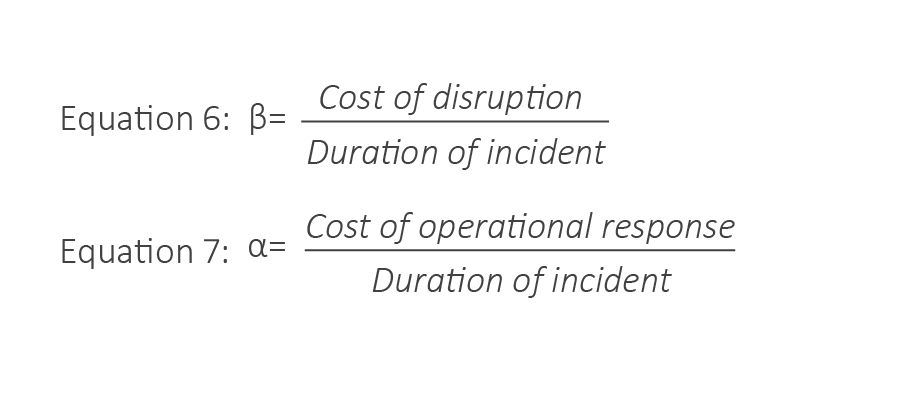
The difference in incident duration (∆T) in minutes is calculated using:
- available fire service data, or in the absence of this data, the FBIM
- mean incident task durations representing baseline responses and enhanced quality of response and/or a reduction in time for effective action to commence upon arrival as a result of enhanced high-fidelity training, represented by a reduction in task timeframes (excluding turn out and travel times). The reduction in task timeframes is representative of improved performance as a result of high-fidelity training (Tabassi, Ramli & Abu Bakar 2012; LaCerra et al. 2018; Sawyer et al. 2017) and is conservatively estimated at 5%.
Data for all incident types was not located. Some incidents, including road accidents, may be considered ‘instantaneous’ where the full extent of the physical damage to the asset occurs on impact. In these circumstances, enhanced response and rescue efficiency may not result in reduced financial damage but may reduce rates of mortality and morbidity. Accordingly, it may be appropriate for φ to be assigned a value of zero where this occurs, noting the reduction in these risks to the community (through more effective emergency service action) and the additional benefit of reductions in firefighter injuries and fatalities. The latter impose significant financial, morale and reputational costs on emergency services and any quantifiable reductions could be incorporated into the assessment.
Producer surplus (PS) is the difference between what the producer gets paid for a good or service and the variable cost of production (Hutchinson 2016). For the purposes of the financial analysis of a new emergency services training facility, there will be no difference between the salaries paid to the individual emergency services workers and corporate staff of the existing and proposed facilities, and any difference in salary costs associated with training programs will be captured when calculating operating costs (CO). In the context of emergency services, PS will, however, include increased volunteer responder rates whose service financially offsets the salary of paid responders. Providing suitable and beneficial training is a major factor in volunteer retention (McLennan et al. 2009; Birch A 2011; Kim, Kim & Yoo 2018) and it is reasonable to assume improvements in volunteer training will result in some improvement in volunteer retention. In the absence of data, this retention rate must be assumed and justified by the project team. Producer surplus (PS) is calculated using Equation 8.

Where VR is the number of volunteers retained as a result of improved training, SS is the salary cost of the staff that would be required in lieu of the volunteers and UF is the uncertainty factor applied to recurrent benefits.
Capital investment (Ci) is the initial, non-repeating capital costs and benefits of the project, represented by Equation 9.

Where CP is the total capital cost of the new project including design and build, as well as any land purchase and rehabilitation; CR is the rebuild costs that would be required to replace the end-of-life existing training facility and maintain the existing training delivery level and SP is the proceeds of sale of the existing site and facility, land offset benefits and other economic benefits directly related to the release of the existing facility.
It should be noted the equations presented in this model are not exclusive to fire services, with the ability for police, paramedic or other emergency service incidents including marine rescue or land search to be substituted or added to the equation where required.
Case study
In order to demonstrate the suitability and application of the EST-FRM for inclusion in a business case for a new emergency services training centre, the following case study is presented for a facility in Newtown (a fictitious capital city). Due to the nature of the project, it is not possible to complete market valuations for guidance or comparison and the EST-FRM is applied. An uncertainty factor (UF) of 2 is applied and a discount rate (D) of 7% is used with sensitivity analysis of 3% and 10%.
A business case for a new training centre in Newtown is developed for a fire and emergency service that provides emergency response to fire, hazardous materials, rescue, storm and flooding. Details relevant to the model are:
- the existing facility is at end-of-life and would costs $60 million to replace like-for-like facilities without enhanced training, therefore CR is $60,000,000
- the initial cost estimates of a new training centre is $140 million and will have a life span of 40 years. Rather than being sold, the existing training facility will be demolished and rehabilitated at a cost of $8 million as part of a threatened ecological community environmental plan, therefore CP is $148,000,000 and t is 40 years
- the value of the threatened ecological community (once rehabilitated) was assessed to provide a financial offset of $7 million, therefore SP is $7,000,000
- the total capital investment (Ci) was calculated using Equation 9 as $81,000,000
- business analysts identified the future operations costs (salaries, goods, services and support) of the new facility to be $12 million, an increase from the current operating costs of $1 million due to changes to staff structure and the number of training courses required to run each year. Maintenance costs of the existing facility are $1.2 million per year while the new facility is forecast to have reduced annual maintenance costs of $800,000 per year, an annual savings of $400,000 per year (reduced to $200,000 once the uncertainty factor is considered). The change in budget (B) is -$800,000.
- no external effects have been identified, therefore EE is 0
- Newtown volunteer services have reported that inadequate training is a significant factor in the retention of volunteers. For the purposes of the case study, it is conservatively assumed that the improved training will result in the retention of 1% of the total number of volunteer responders within the service, equating to 20 personnel retained each year. The average annual salary of a frontline responder in full-time employment is $75,000. The uncertainty factor (UF) of 2 applies. Producer surplus (PS) is therefore calculated using Equation 3 as $750,000.
For the purposes of the case study, the hypothetical Newtown 10-year incident data is detailed in Table 3, including the average annual number of incidents involving life, n(L), incidents involving property damage only, n(P) and incidents involving both life and property n(L+P). The values for ∅, φ, β and α are identified. To illustrate how the FBIM and RUIM can be used, relevant data was calculated using the FBIM and RUIM as identified in Table 3. Adopting a conservative approach, it is assumed all damage as a result of vehicle crashes occurs at the moment of impact and φ is assigned a value of zero for road crash rescue incidents. Applying the uncertainty factor (UF) of 2, unadjusted service utility (SU) using Equation 4, is also detailed in Table 3.
Table 3: Case study incident data.
| Incident type | ɸ | ϕ | α | β | n(L) | n(P) | n(L+P) | ∆T | Benefit ($) |
| Fire alarm - no fire | 0 | 0 | 106 | 53 | 0.00 | 700 | 700.00 | 1.91 | 211,470 |
| Structure fire (detached house) | 2,631 | 2,587 | 106 | 53 | 4 | 676 | 680.00 | 3.72 | 6,908,944 |
| Structure fire (apartment buildings) | 3,999 | 3,163 | 106 | 53 | 3 | 52 | 55.00 | 3.72 | 685,313 |
| Structure fire (medical facilities and hotels) | 2,417 | 1,979 | 106 | 53 | 0.50 | 13 | 13.50 | 5.53 | 159,961 |
| Structure fire (shops, schools and restaurants) | 24,746 | 21,923 | 106 | 53 | 0.06 | 10 | 10.06 | 5.53 | 1,222,702 |
| Structure fire (agriculture and farm buildings) | 9,503 | 9,226 | 106 | 53 | 0.20 | 4 | 4.20 | 5.53 | 217,089 |
| Structure fire (chemical industry) | 11,473 | 11,089 | 106 | 53 | 0.30 | 7 | 7.30 | 5.53 | 452,224 |
| Structure fire (other industry and warehouses) | 6,567 | 5,558 | 106 | 53 | 0.20 | 11 | 11.20 | 5.53 | 353,259 |
| Bushfire - productive forest | 527 | 527 | 106 | 53 | 0.30 | 3 | 3.30 | 124 | 27,852 |
| Bushfire - other | 219 | 219 | 106 | 53 | 0.02 | 230 | 230.02 | 124 | 1,069,207 |
| Traffic accident (road traffic) | 3,851 | 0 | 106 | 53 | 70 | 180 | 250.00 | 5 | 1,546,600 |
| Hazardous materials | 174 | 174 | 106 | 53 | 0.05 | 80 | 80.05 | 6.85 | 181,265 |
| Water damage | 49 | 49 | 106 | 53 | 0.01 | 230 | 230.01 | 5 | 239,210 |
| Storm damage | 11 | 11 | 106 | 53 | 0.02 | 437 | 437.02 | 4 | 297,174 |
| Total SU | 13,572,271 | ||||||||
| Total SU with UF applied | 6,786,135 | ||||||||
Notes: For the purposes of the case study, incident data is sourced from a hypothetical Newtown incident statistics unless otherwise specified.
1. Calculated using FBIM for fire alarm response – see Appendix A, Table 5.
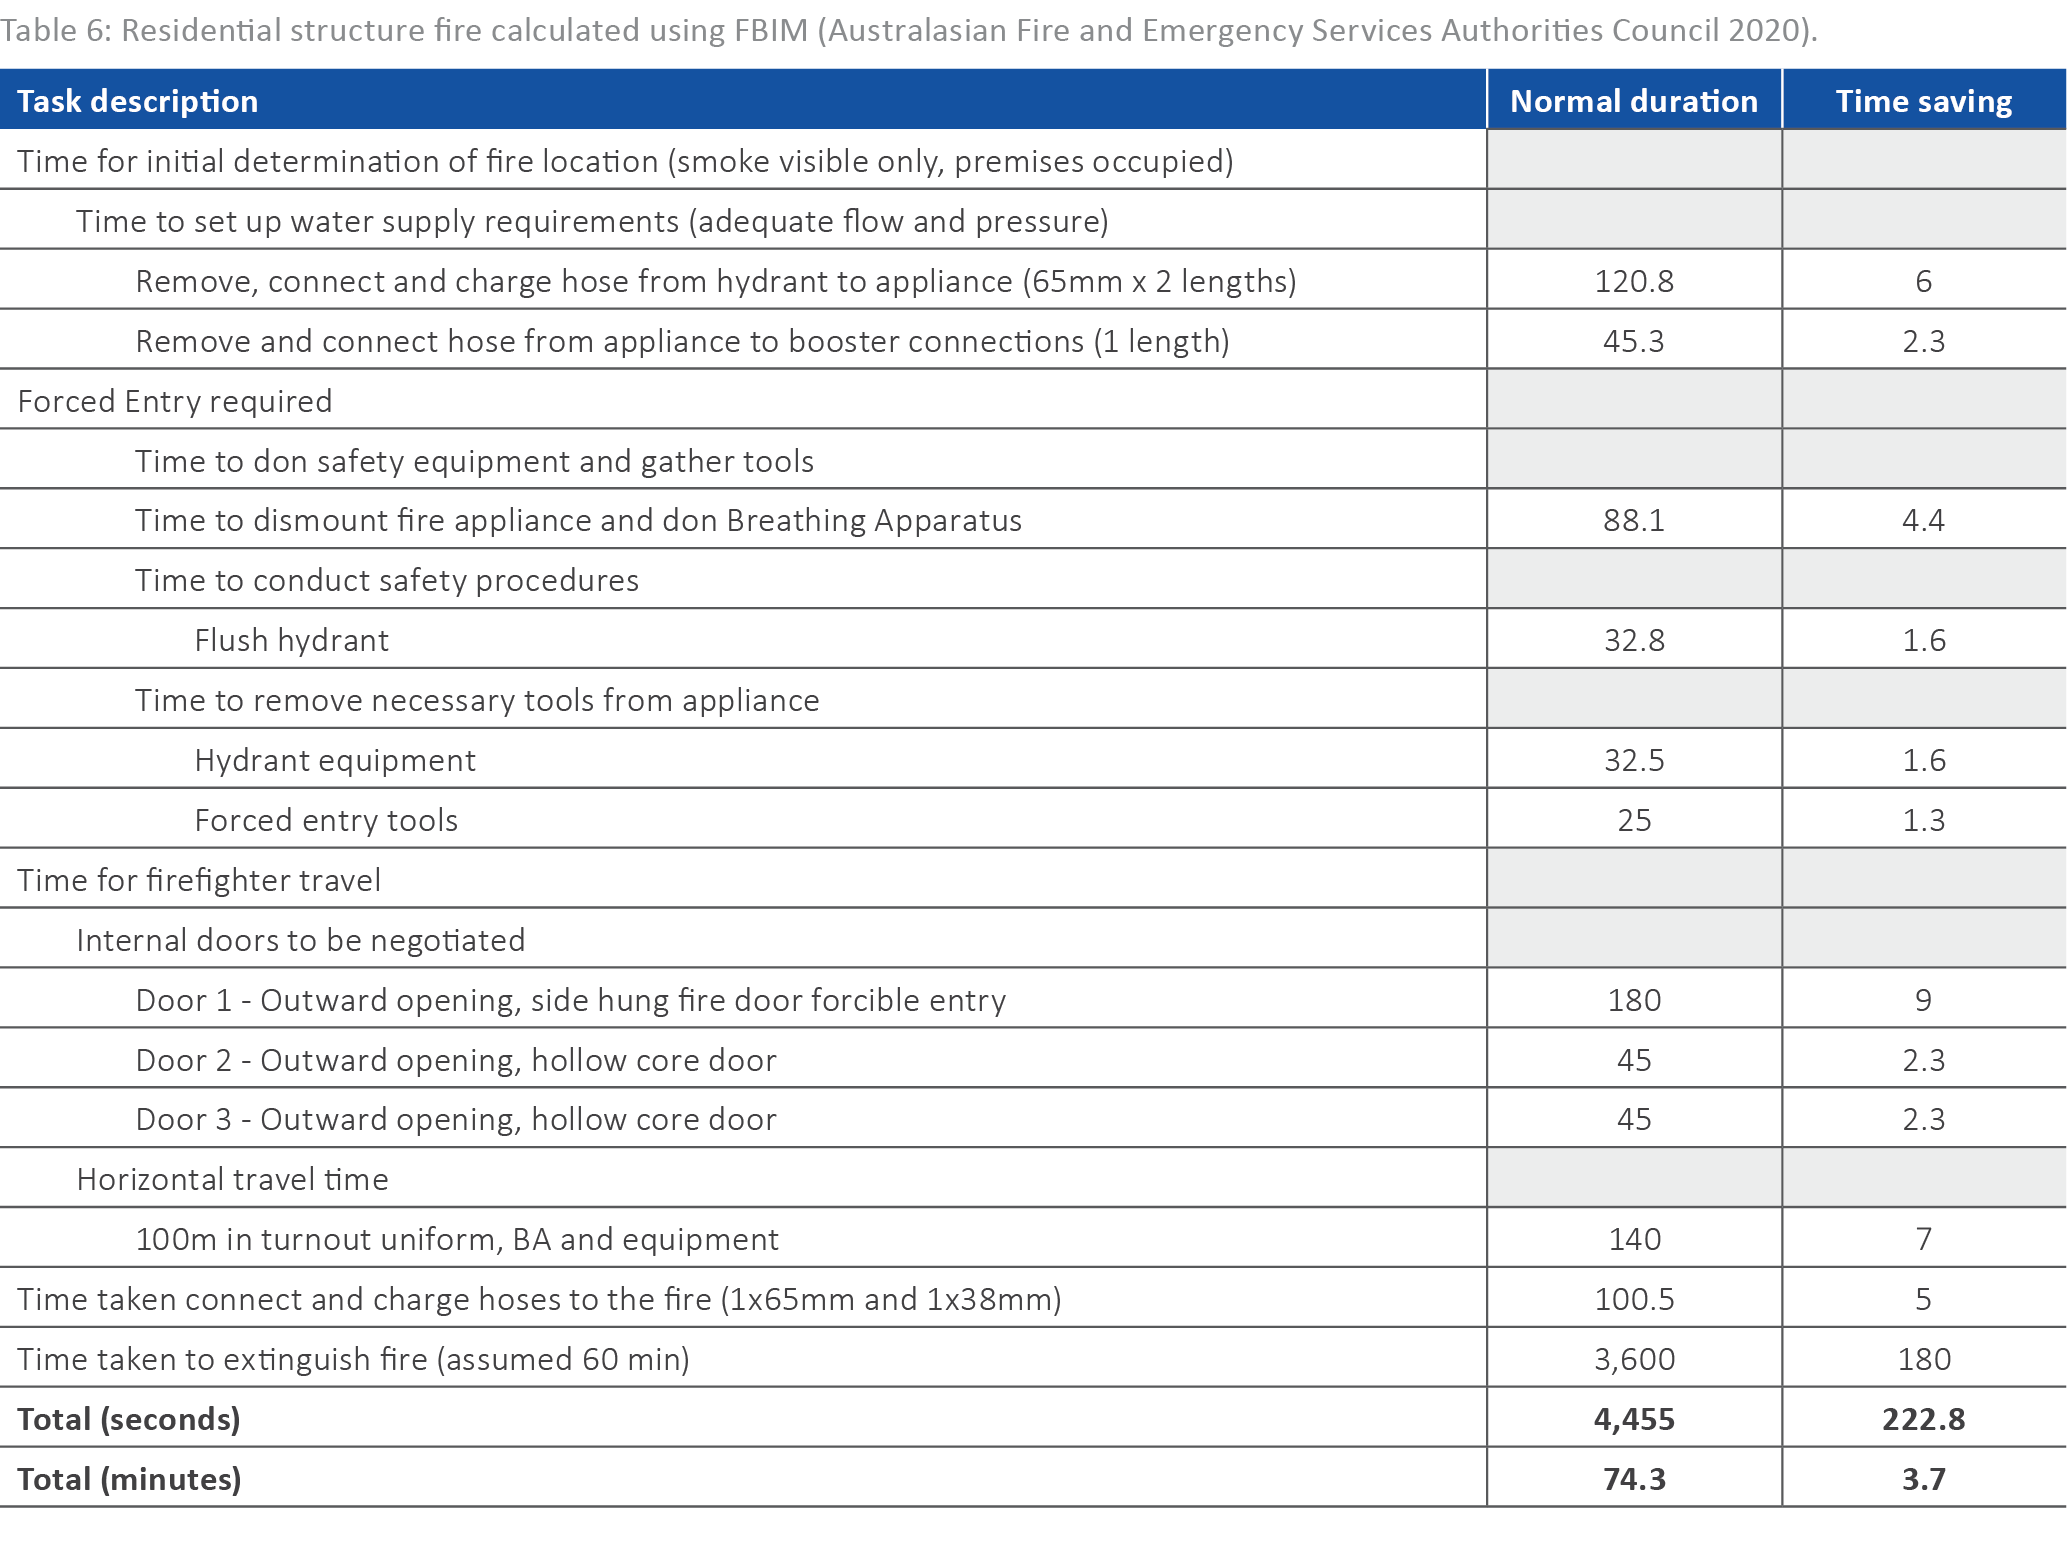
2. Calculated using FBIM for residential dwellings – see Appendix A, Table 6.
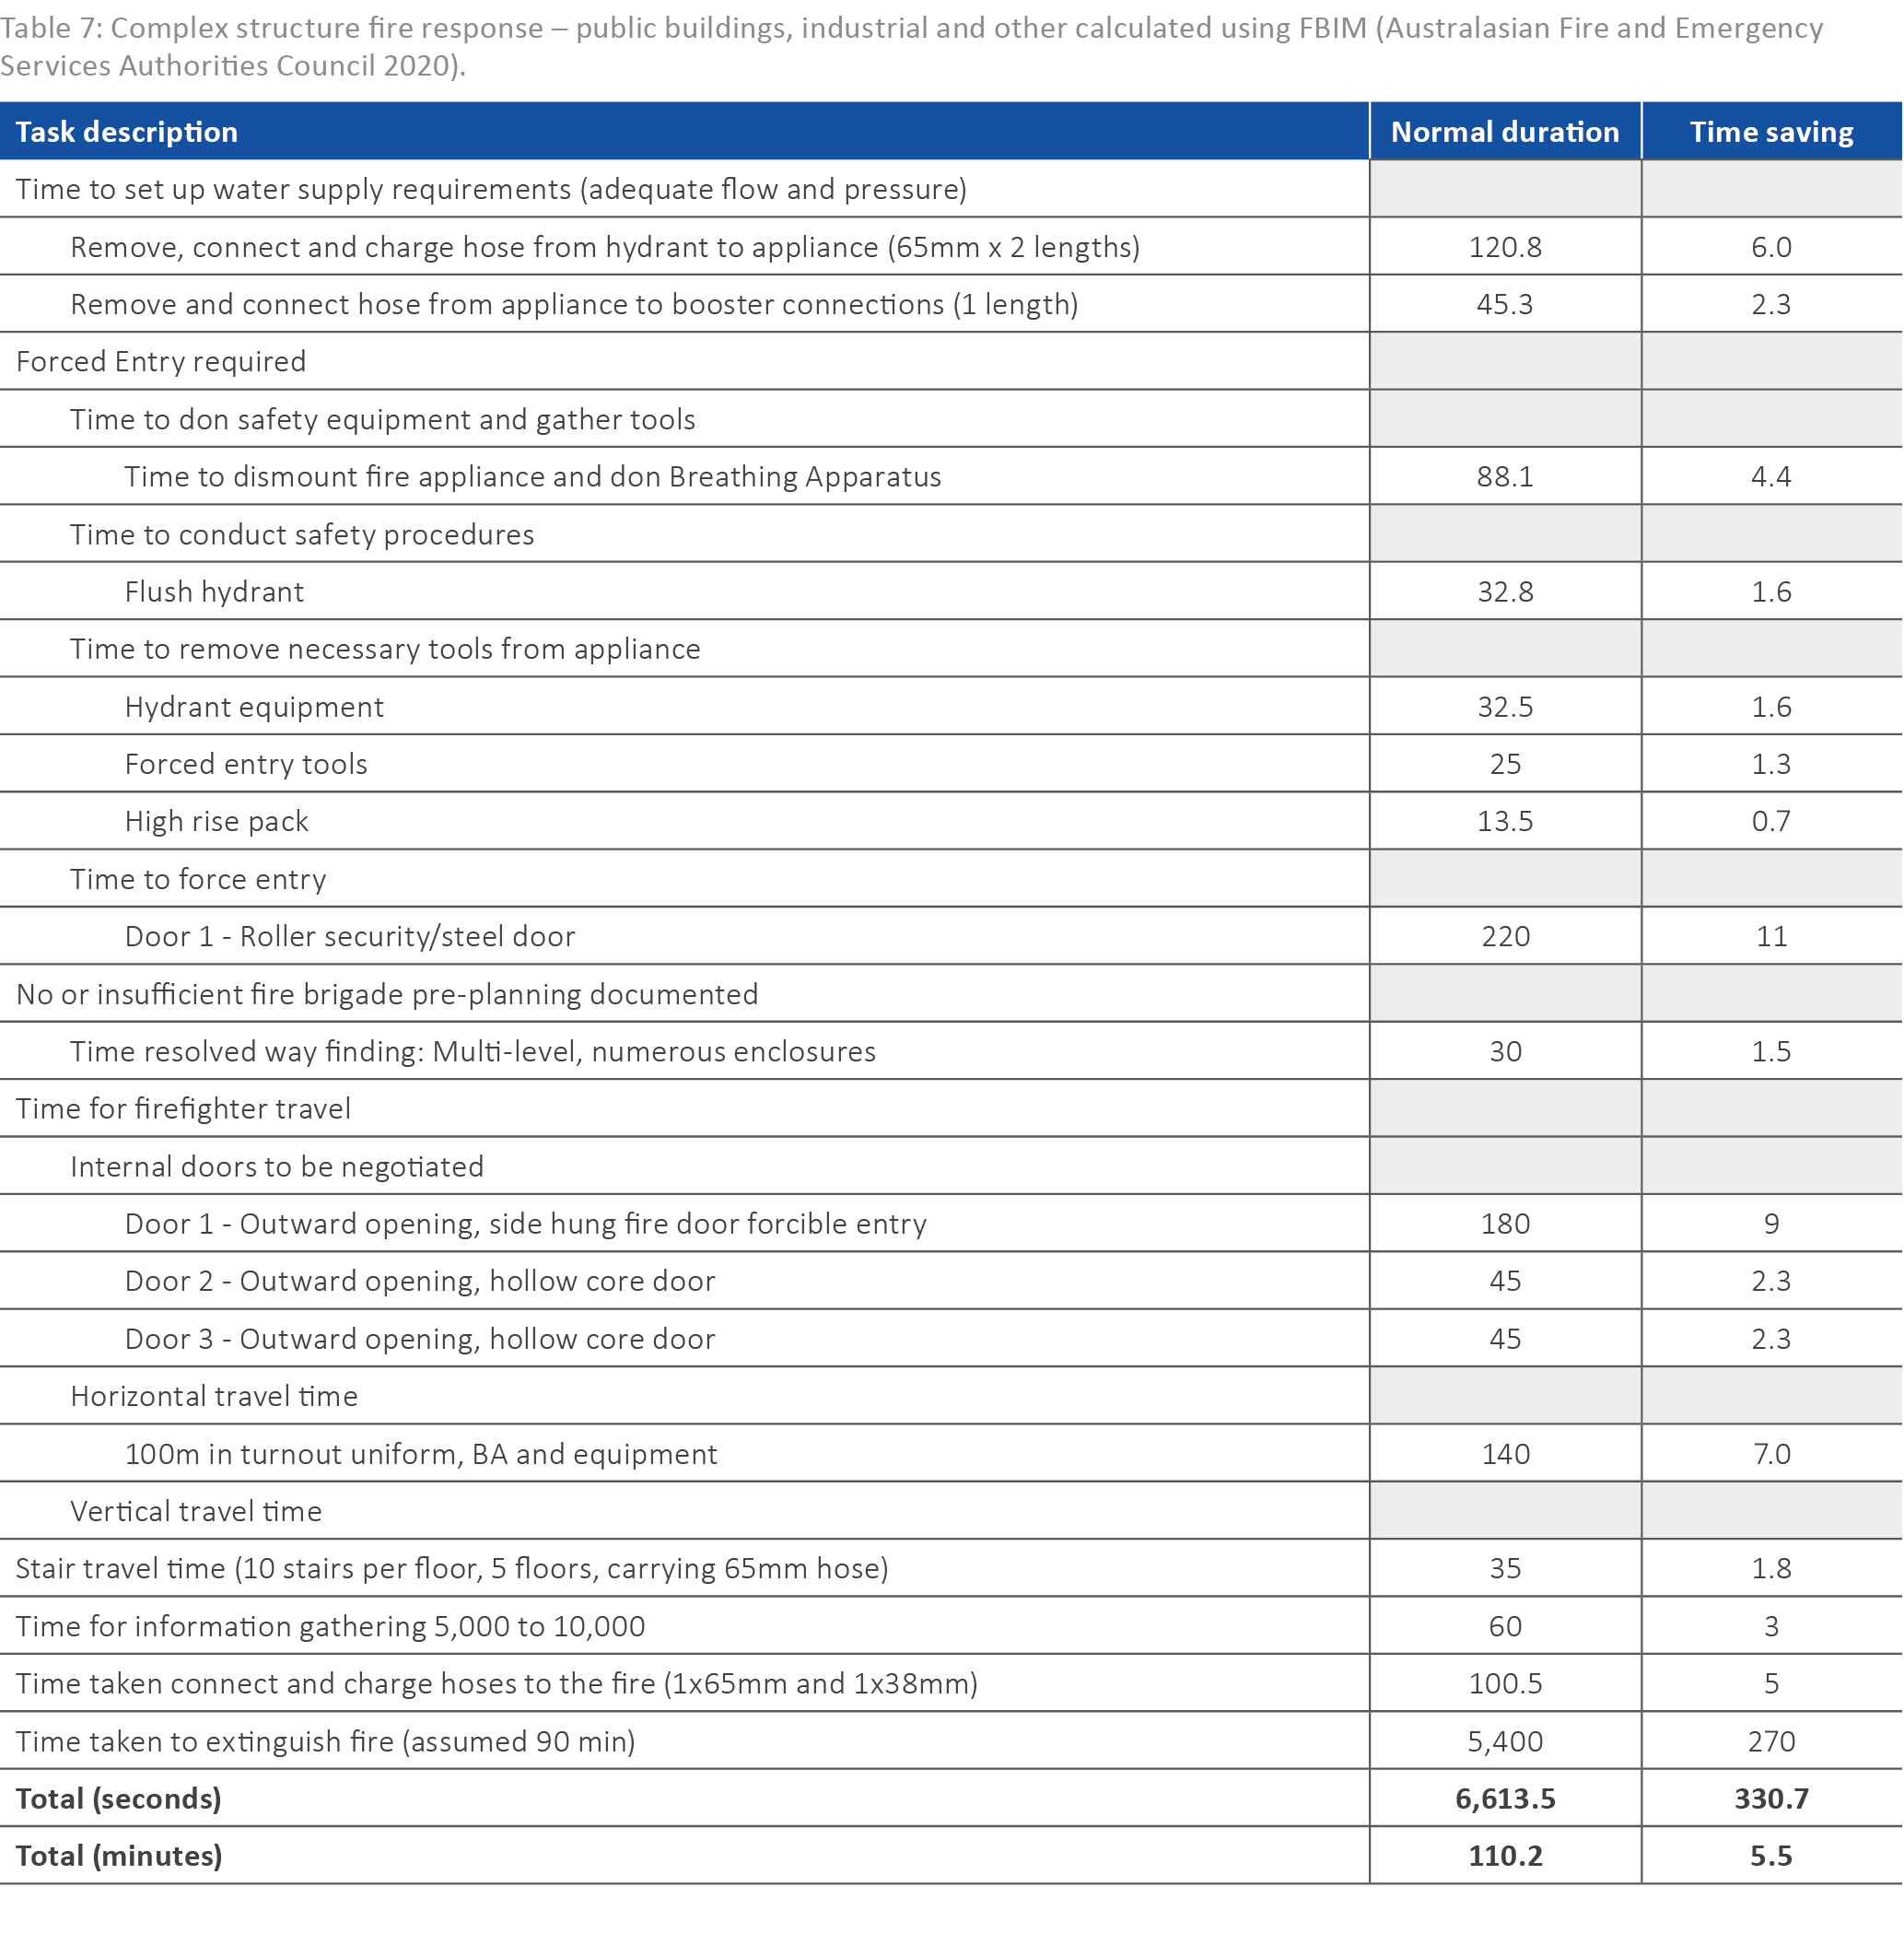
3. Calculated using FBIM for complex structures – see Appendix A, Table 7
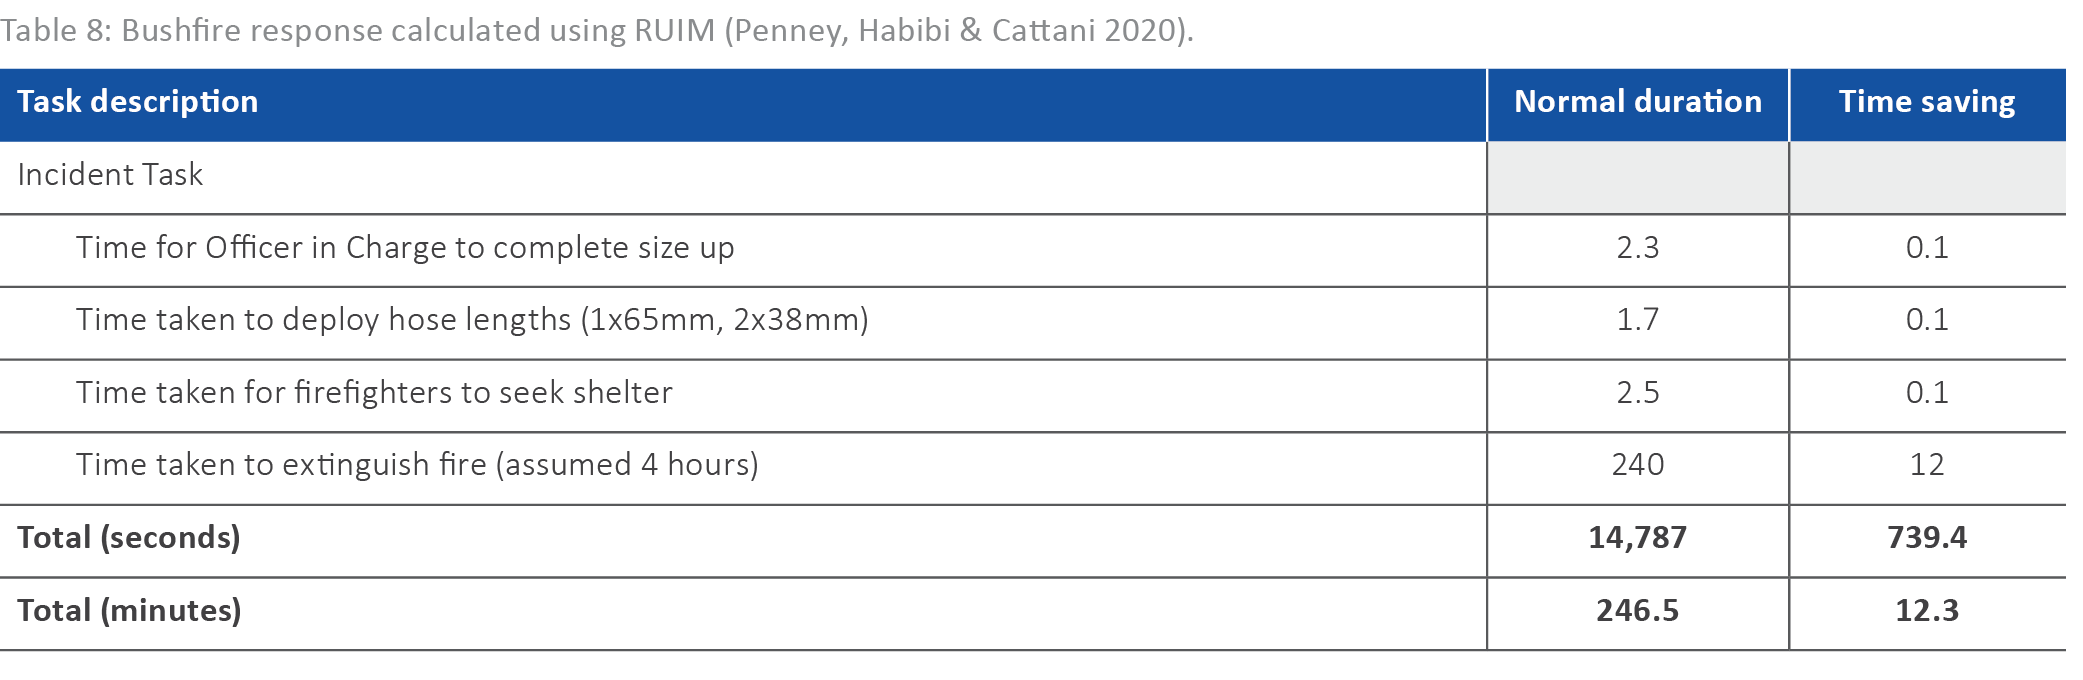
4. Calculated using RUIM for rural urban interface fire response – see Appendix A, Table 8
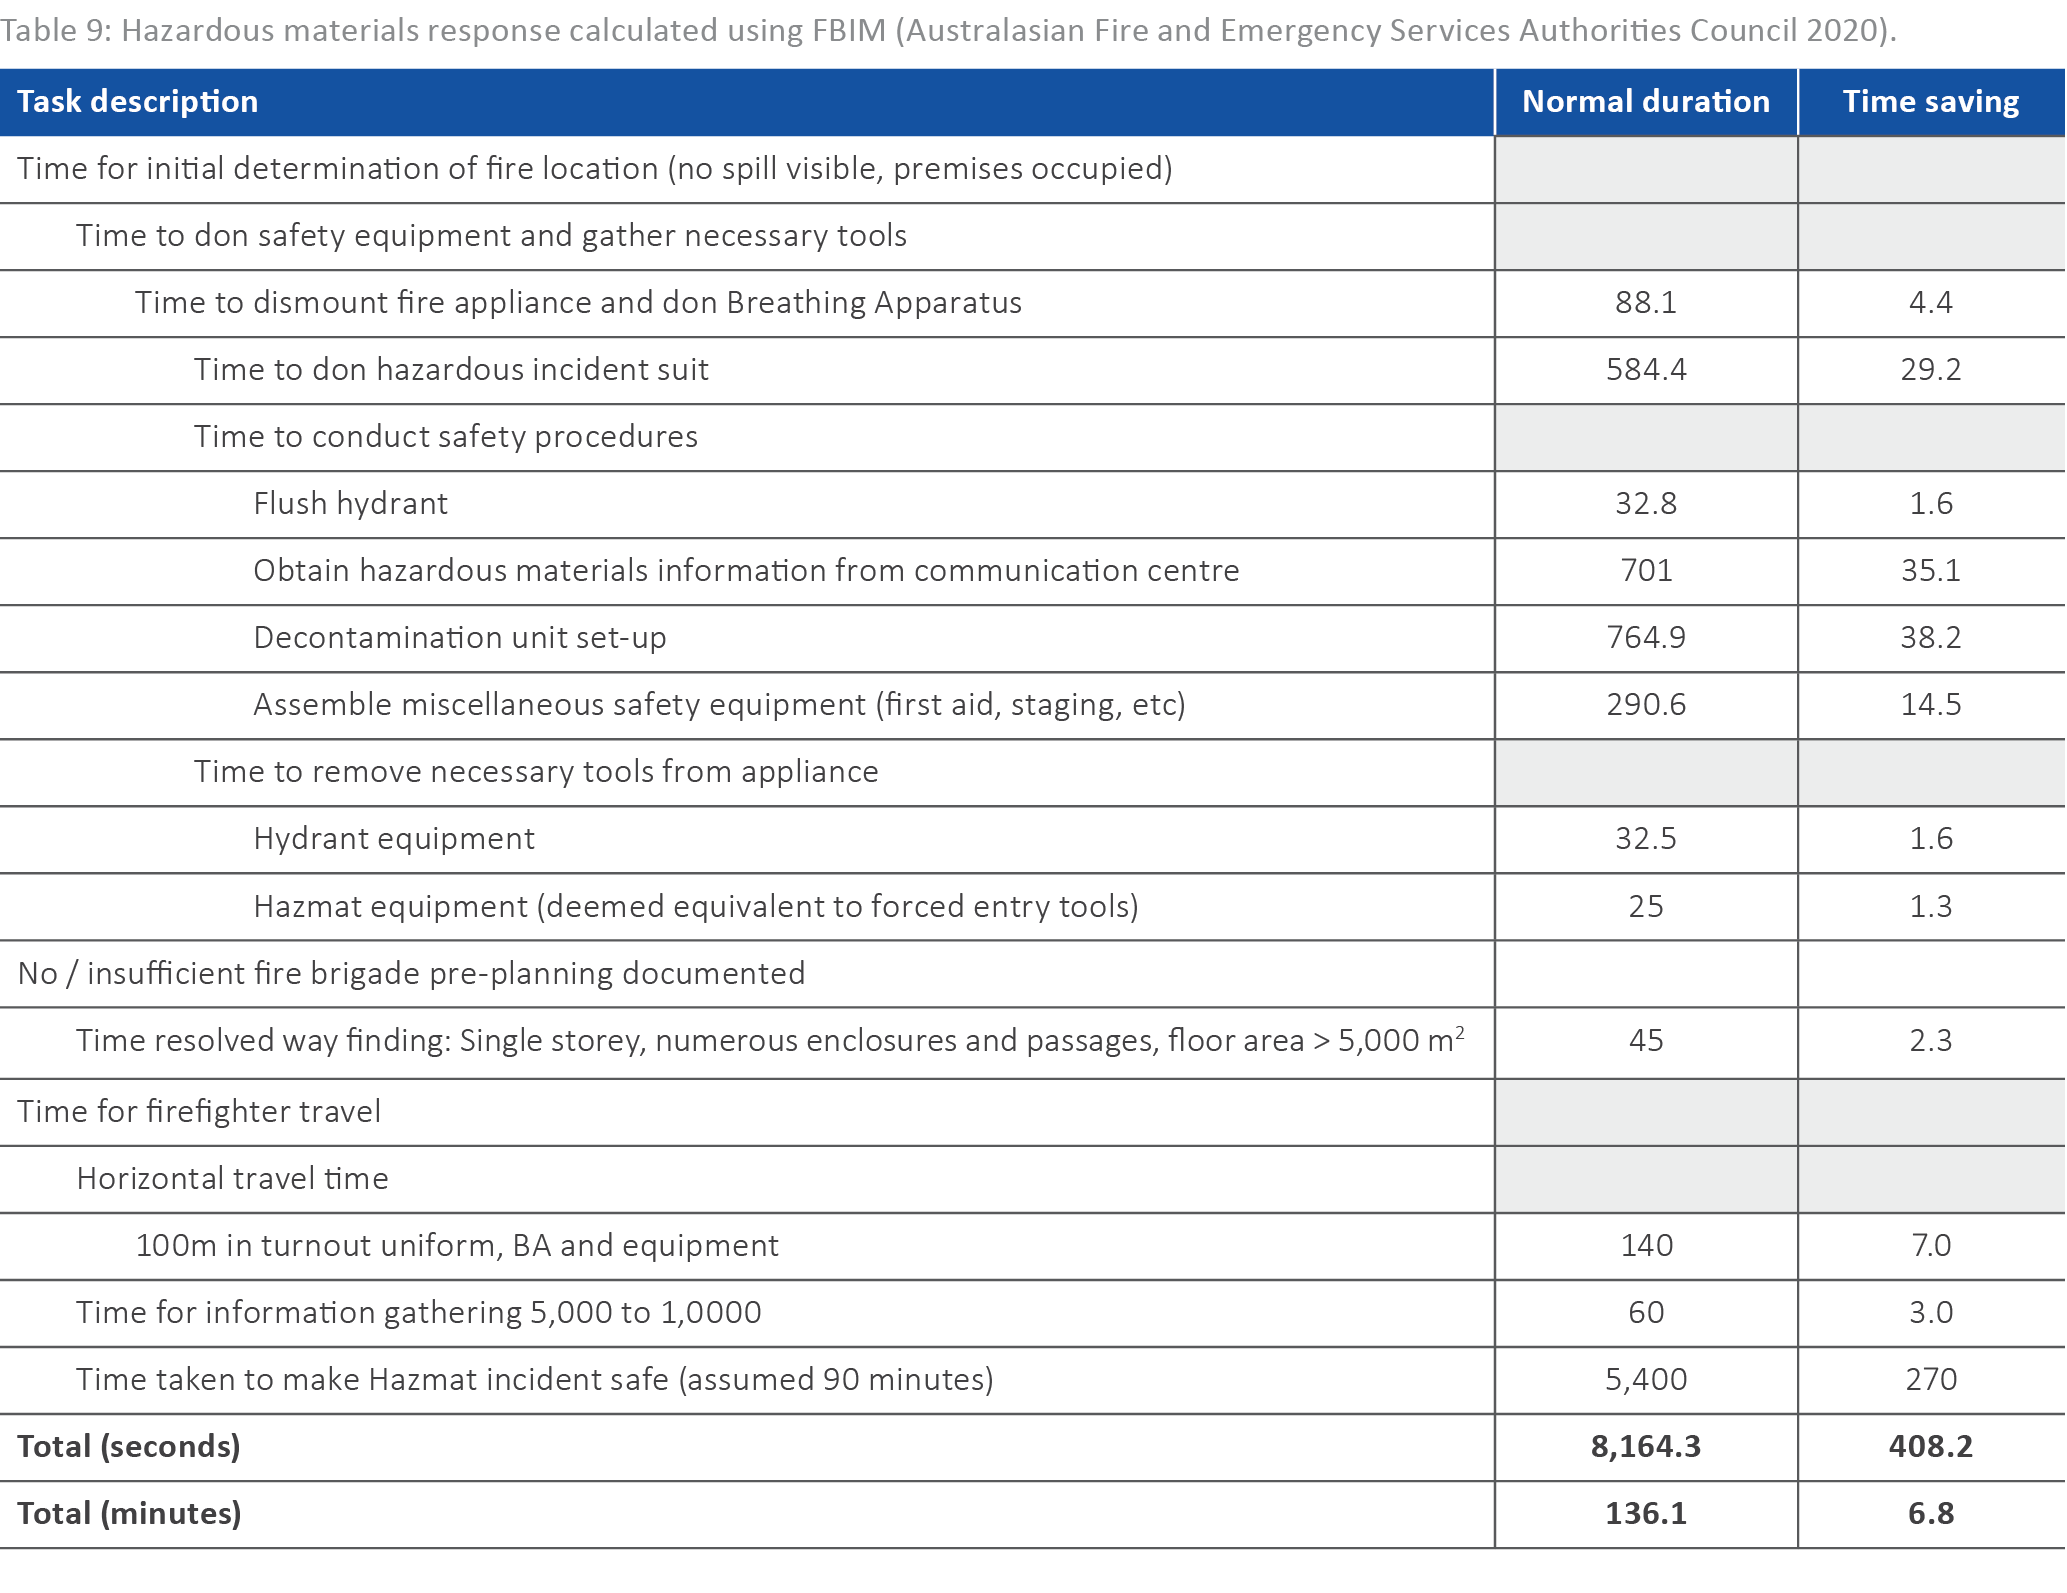
5. Calculated using FBIM for hazardous materials incidents – see Appendix A, Table 9
The annual nominal societal economic value (W) of the project is calculated using Equation 1 as $6,786,085.
In order to calculate NPV using the equations detailed previously, a spreadsheet is created to identify the distribution of annual nominal costs and benefits of the project. Table 4 details an extract of this spreadsheet, with societal economic value (W) and initial capital investment (Ci) shaded and in bold. As detailed in Table 4, following the initial capital outlays and external benefits, the annual components remain unchanged for the duration of the project timeframe. It should be noted that the majority of the project costs, including all capital costs, are incurred at the commencement of the project and are therefore unaffected by the discount factor (Weinholt & Granberg 2015).
Table 4: Nominal annual costs and benefits of the project in AUD.
| Item | Year 0 | Years 1–40 |
| CP (total capital cost) | -148,000,000 | 0 |
| CR (rebuild cost) | 60,000,000 | 0 |
| SP (proceeds of sale) | 7,000,000 | 0 |
| Ci (initial capital investment) | -81,000,000 | 0 |
| B (budgets) | 0 | -800,000 |
| PS (producer surplus) | 0 | 750,000 |
| EE (external effect) | 0 | 0 |
| SU (service utility) | 0 | 6,786,135 |
| W (annual nominal societal economic value) | 0 | 6,786,085 |
The spreadsheet is then used to plot the NPV, including sensitivity analysis, for the lifespan of the project (Figure 1). The results demonstrate that applying a 7% discount factor, the NPV of societal economic benefit associated with the investment in a new high-fidelity emergency services training facility in Newtown is approximately $9.5 million over the lifetime of the proposed facility. The ‘break even’ point (being where the NPV=0) occurs after 27 years. Applying the sensitivity analysis of a 3% discount factor the NPV over the lifetime of the proposed facility is $75.8 million, while a 10% discount factor provides the NPV over the lifetime of the facility of -$14.6 million. Considering the application of the uncertainty factor to benefits only, the model therefore demonstrates that the investment in the Newtown training facility will not only likely to be economically justifiable but will provide a net economic benefit to the community.
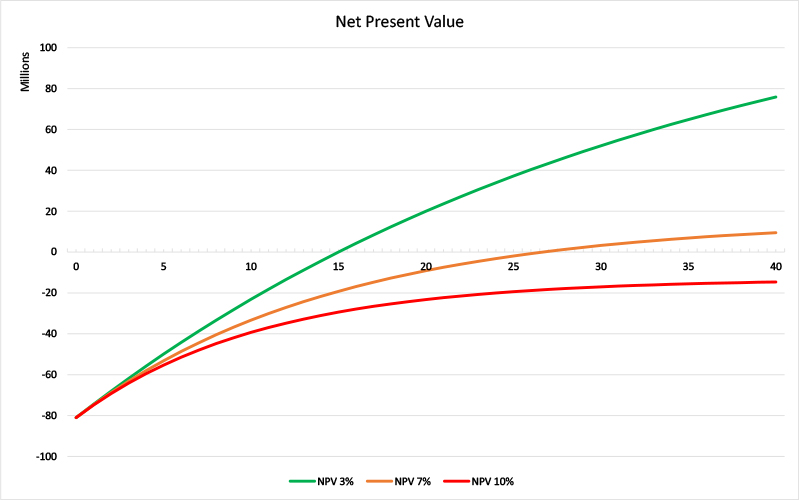
Figure 1: Net present value of the project over the 40 year lifespan.
Limitations
While every effort was made to make the EST-FRM robust, it has limitations:
- As a manual process, it can be time consuming and complex, however, new training facilities represent significant capital expenditure and may be once-in-a-generation investments. It is therefore reasonable to expect detailed financial analysis to occur. This may be addressed through the development of spreadsheets or applications.
- While much of the data, research and models supporting the EST-FRM have been previously published, they are limited to fire services of the eastern states of Australia and Sweden. This stated, it is a model that can be easily adapted to international jurisdictions using local data sets. The inclusion of larger datasets will also strengthen the model.
- In the absence of suitable data, assumptions have been made at some stages of the model. To ensure the limitations of the model are fully comprehended, these assumptions should be clearly identified when the model is applied. Sensitivity analysis may also be beneficial in such instances to improve confidence in the outputs.
- The EST-FRM assesses financial benefits for the defined items only. Other financial aspects and measures including social benefit may be worthwhile considering. For example, research by Kim, Kim and Yoo (2018) may be of benefit when attempting to quantify social benefit.
Conclusion
The EST-FRM builds on existing models and research to provide guidance regarding the economic costs and benefits of investment in emergency services high-fidelity training centres. Incorporation of financial and engineering safety factors to conservatively account for uncertainties enables guidance to be provided in an achievable manner. The model provides a detailed and flexible workflow that can be applied beyond firefighting to all emergency services and response contexts. As demonstrated in the case study, when used correctly by experienced and suitably qualified personnel, the EST-FRM has the potential to determine the financial viability of significant capital investments in emergency services.
Appendix