In Australia, the methodology used for heatwave warnings is different across its states and territories. The Bureau of Meteorology is redesigning its heatwave product suite to provide nationally consistent heatwave forecasts and warnings.
Australia’s sequence of unprecedented disasters during the 2019–20 Black Summer were not unexpected. There has been declining rainfall over the southern half of Australia with Australia’s average temperature rising by 1.4° C since 1910.1 Record 2- and 3-year rainfall deficits over eastern Australia (Figure 1) created tinder-dry fuels and an environment prone to extreme heatwaves (Figure 2). Subsequent fires and persistent smoke were responsible for 332 and 417 excess deaths3, respectively, and an increase in respiratory problems and other health impacts in New South Wales and the Australian Capital Territory.4
It takes longer to detect heatwave mortality due to strict medical and coronial conventions. However, the death toll may be in the hundreds, noting studies that have demonstrated the disproportionate impact of heatwaves over other climatic hazards.5
Indirectly, heatwaves played a large part in the size and severity of the Black Summer bushfires. Heatwaves are defined by the combined effect of high minimum and maximum temperatures with the former playing the greatest role. Higher minimum temperatures reduce the diurnal cooling cycle and sets up earlier and more sustained high temperatures, rapidly building heat stored in the environment. The Bureau of Meteorology combines long- and short-term daily (average of maximum and minimum) temperatures over a 3-day period to determine heatwave severity as shown in Figure 2.6
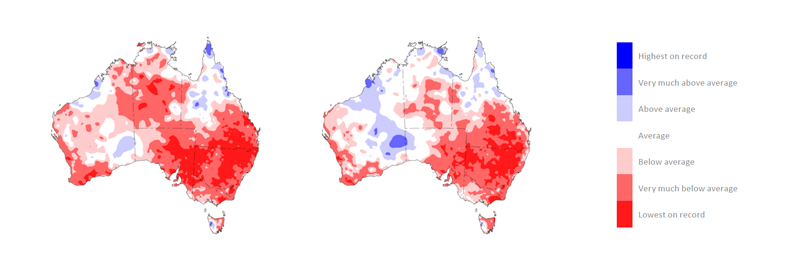
Figure 1: Rainfall deciles for the 24 months from January 2018 to December 2019 (left) and 36 months from January 2017 to December 2019 (right), based on all years from 1900.
High minimum temperatures are extremely significant as it is difficult, if not impossible, to form a surface inversion, allowing the upper wind structure to remain coupled with the fire overnight. Without the cooling effect and higher relative humidity of a nocturnal surface inversion, fires burn as intensely at night as during the day. Fires expand further and burn more erratically without the normal benefit of reduced overnight fire danger.
The NSW sequences of heatwaves and property impacts are shown in Figure 3. The proportion of NSW that was affected by low-intensity or severe heatwaves can be seen to correlate with property losses the week finishing 23 November. At that time, nearly 80 per cent of NSW experienced a low-intensity heatwave (18 per cent severe) and over 500 homes and structures were destroyed.
The next 2 major destructive bushfire events in January 2020 followed a 6-week heatwave affecting most of NSW, with a major heatwave in early February aligning with further damage.
Antecedent heatwave severity and accumulated heat load is yet to be systematically explored for the relationship with subsequent fire and smoke activity and presents rich grounds for further research.
The Bureau of Meteorology heatwave product is statically displayed and based on a national view of Australia.7 These forecasts do not support the different needs of stakeholders; their processes or geographical factors. The Bureau's heatwave project team has carried out extensive interviews with health and emergency services stakeholders from government agencies, as well as not-for-profit groups such as Australian Red Cross, to ensure new products meet their needs. Beta products including town and weather district summaries will be trialled with partners in the 2020–21 summer season. Feedback received will help build an operational product intended for release in 2021–22.
The challenge of quantifying the direct human health impacts of heatwaves has been recently studied through a collaborative research project. A 12-month DIPA8 funded PEAN9 project was completed during 2020, which aimed to ‘Reduce Illness and Lives Lost from Heatwaves' (RILLH). A multi-agency collaboration between the Bureau of Meteorology, Department of Health, Australian Bureau of Statistics, Geoscience Australia, Department of Agriculture, Water and the Environment, Australian Institute of Health and Welfare and the Bushfire and Natural Hazards CRC, the RILLH used big data to demonstrate the utility of linked social and environmental data from multiple agencies through the MADIP10 data asset to understand complex, coupled social and environmental problems. Heatwave vulnerability has been calculated at neighbourhood-level and for individual-level factors for mortality and morbidity.
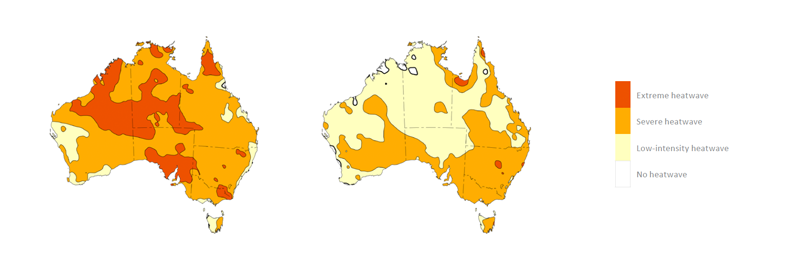
Figure 2: Highest heatwave severity for December 2019 (left) and January 2020 (right).
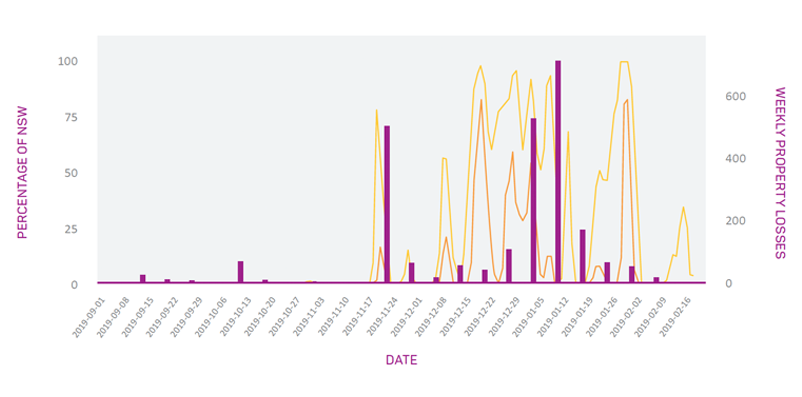
Figure 3: Chronology of heatwave severity and homes lost in NSW from September 2019 to February 2020. Proportion of NSW affected by all (orange line) and severe (red line) heatwaves (left axis). Homes destroyed (purple bar) sourced from NSW Rural Fire Service Building Impact Assessment.
There is also an opportunity for warning agencies such as the Bureau and partners in health and emergency services to tailor advice to communities, agencies and individuals according to the risks inherent in where they live or their type of health and environmental exposures.
The study determined neighbourhood and individual-level risk factors separately (Table 1). Most of the study’s neighbourhood-level spatial results were validated using the linked individual-level data, demonstrating the value of the neighbourhood-level results.
Table 1: RILLH results show the influence of neighbourhood-level and individual-level factors on the heatwave-mortality relationship in New South Wales.
| Theme | Neighbourhood-level | Individual-level |
| Heat Exposure |
|
|
| Socio-economic status |
|
|
| Household composition and instance of disability |
|
|
| Language and culture |
|
|
| Housing and transportation |
|
|
| Health status and risk factors |
|
|
| Consistent risk factors across levels | Low-equivalised household income, over 65 years and living alone, dwellings with single parents, need assistance, insufficient English language proficiency, no access to a vehicle, diabetes, mental health conditions. | |
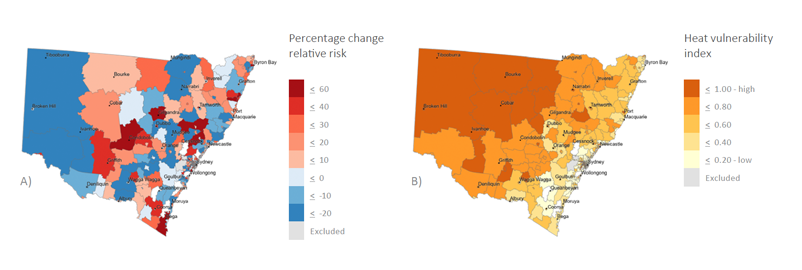
Figure 4: A) Relative Risk of heatwave-related mortality and B) overall heat health vulnerability index in New South Wales, (2007–17).
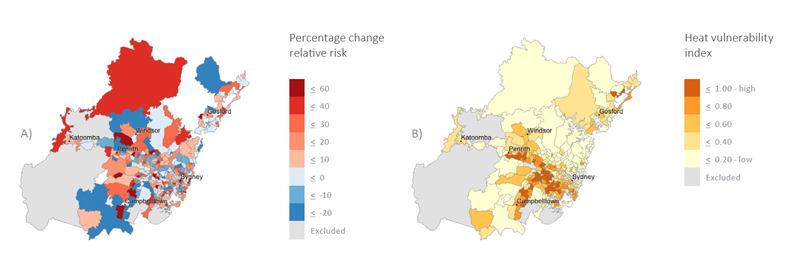
Figure 5: A) Relative Risk of heatwave- related mortality (2007–17) and B) overall heat health vulnerability index in the Sydney Greater Capital Area Statistical Area.
As an example, Figure 4 demonstrates spatial variability in mortality risk and heat-health vulnerability for NSW. Relative Risk in Figures 4 and 5 is a measure of increased or decreased impact during heatwaves compared to comparable non-heatwave periods. Heat vulnerability index is a measure of the combined effects of demographic, socioeconomic, health and the natural and built environment. The results show there is an opportunity to tailor advice to the needs of different regions.
Similarly, the contrast in vulnerability across Sydney in Figure 5 can help authorities develop policy, mitigation and response strategies to effectively manage exposure, sensitivity and adaptive capacity measures.
Heatwaves impact segments of the population in different ways with impacts related to individual characteristics of people and the types of places they live in (social and built environment). Vulnerability to heatwaves exhibits distinct geographies.
The RILLH project has generated a rich set of results with implications for strategic policy and education programs to position and prepare communities for the dangers of increasingly severe heatwaves.
The RILLH project highlights the value of high-quality multi-agency partnership studies and supports a strategic aim to enhance warnings with local behavioural recommendations to improve the value of future heatwave warnings.
Endnotes
1 Bettio L, Nairn JR, McGibbony SC & Hope P 2019, A heatwave forecast service for Aaustralia, Royal Society of Victoria. doi: 10.1071/RS19006
2 Commonwealth of Australia 2020, Royal Commission into National Natural Disaster Arrangements Report. At: https://naturaldisaster.royalcommission.gov.au/system/files/2020-11/Royal Commission into National Natural Disaster Arrangements - Report %5Baccessible%5D.pdf [17 November 2020].
3 Borchers Arriagada N, Palmer AJ, Bowman DMJS, Morgan GG, Jalaludin BB & Johnson FH 2020, Unprecedented smoke‐related health burden associated with the 2019–20 bushfires in eastern Australia, Research letters, The Medical Journal of Australia, vol. 213, no. 6, pp.282–83. doi: 10.5694/mja2.50545
4 Australian Institute of Health and Welfare 2020, Australian bushfires 2019–20: exploring the short-term health impacts, Summary.
At: aihw.gov.au.
5 Coates L, Haynes K, O’Brien J, McAneney J, Dimer de Olivera F 2014, Exploring 167 years of vulnerability: An examination of extreme heat events in Australia 1844–2010, Environmental Science & Policy. Elsevier, vol. 42, pp.33–44. doi: 10.1016/J.ENVSCI.2014.05.003
6 Nairn JR & Fawcett RJB 2014, The excess heat factor: A metric for heatwave intensity and its use in classifying heatwave severity, International Journal of Environmental Research and Public Health, vol. 12, no. 1. doi: 10.3390/ijerph120100227
7 Bureau of Meteorology 2020, State of The Climate 2020. At: www.bom.gov.au/state-of-the-climate/ [17 November 2020].
8 Data Integration Partnership for Australia is a 3-year (2017-20) investment to maximise the use and value of Australian Government data assets. See www.pmc.gov.au/public-data/data-integration-partnership-australia.
9 Physical Environment Analysis Network, Australian Government agencies working together to analyse government data to generate case studies and insights into complex problems. www.pean.gov.au/
10 Multi-Agency Data Integration Project is a secure data asset combining information on health, education, government payments, income and taxation, employment, and population demographics (including the Census) over time. At: www.abs. gov.au/websitedbs/D3310114.nsf/home/Multi-Agency%20Data%20 Integration%20Project%20(MADIP), [15 January 2021].