Air pollution causes premature deaths and is a significant environmental hazard. In 1975, the New South Wales Government established an air quality alert system, which has been regularly upgraded and expanded.
Outdoor air pollution contributed to 4.2 million deaths globally in 2015.1 In Australia, air pollution was attributable to 2566 premature deaths in 2015.2 Air pollution affects people’s health via chronic effects due to long-term exposure and acute effects from short-term exposure. The short-term effects were brought keenly to the attention of the community during the 2019–20 Black Summer Australian bushfires with estimates of 417 deaths from exposure to bushfire smoke.3
An effective air pollution alert and forecasting service provides community benefit by alerting people when air pollution exceeds standards and by providing advice that assists individuals to minimise their exposure.4 Short-term air pollution forecasts extend this service by providing locally specific information that allows people to plan ahead.
Beginnings and the Sydney Pollution Index
Air pollution has been monitored in NSW since 1951 and continuous monitoring of ozone and fine particles (visibility) started in the early 1970s. Daily reports of air quality issued from 1975 initially reported particulates (visibility), carbon monoxide, sulfur dioxide and ozone. However, these reports used scientific terminology and people could not easily interpret the information.
On 19 March 1976, 13 children suffering chest pains and breathing difficulties were taken from a Sydney high school to a district hospital.5 Partly in response, the Sydney Pollution Index (SPI) was established in 1978. The SPI was intended to simplify air pollution reporting. It provided daily media releases and was available on a phone message service. The SPI used a simple linear scale (Equation 1) based on the maximum hourly daytime (6am to 3pm) levels of particles (visibility measured in the CBD) and ozone (measured at Lidcombe). The 2 levels were combined and expressed as a single number. The index was classified into categories of low (0–25), medium (26–50) and high (>50) (Table 1). On high pollution days, SPI media coverage was good and hundreds of calls were made to the recorded phone message.
Equation 1:
SPI = max {100 p\s} where Pi = conc.of pollutant
i and Si = pollutant standard for i
The SPI report included an air pollution forecast for Sydney for the next day. The forecast was based on empirical methods and relied on air pollution observations and the Bureau of Meteorology weather forecast for Sydney for maximum and minimum temperatures, atmospheric stability and mixed layer height.
The NSW Regional Pollution Index
In May 1991, Sydney experienced a major air pollution episode when many hazard-reduction burns were underway around the city. The weather conditions resulted in calm days and still nights that lead to a build up of smoke. This resulted in significant community concern about air quality and health. The NSW Government conducted public air quality summits and produced the Metropolitan Air Quality Study (MAQS). The MAQS aimed to develop an extensive understanding of air pollution in the Sydney, Illawarra and lower Hunter regions as well as a system to predict air quality in the future to support long-term air quality management.
MAQS delivered an updated Regional Pollution Index (RPI).6 The RPI was produced for 3 Sydney regions (central-east, northwest, southwest), 3 sites in the lower Hunter (Newcastle, Wallsend, Beresfield) and 3 sites in the Illawarra (Wollongong, Kembla Grange, Albion Park). It kept the categories and index numbering of the SPI but was expanded to cover an entire day with morning and afternoon reports (Table 1). Forecasting continued to use empirical methods but was enhanced with daily air pollution weather forecasts from the Bureau of Meteorology tailored to NSW Government needs.7
The NSW Air Quality Index
In June 1998, the introduction of the National Environmental Protection (Ambient Air Quality) Measure led to major changes to air quality reporting. Changes included new national air quality standards, measurement requirements and a consistent national reporting process. Standards were introduced for ozone, carbon monoxide, sulfur dioxide, nitrogen dioxide, particles (PM10, PM2.5) and lead. In 2008, the RPI was replaced by an Air Quality Index (AQI) based on these criteria pollutants and visibility (Table 2).
The NSW alert system was expanded and alerts were now triggered automatically when any pollutant at a station exceeded standards. Any member of the public could subscribe to receive alerts, tailored to their specific region or location of interest, delivered via SMS or email.
As the PM10 and PM2.5 standards were based on a daily average, NSW used a rolling 24-hour average to provide hourly updates on particle pollution. While this allowed PM10 and PM2.5 to be integrated into the AQI, a downside was that often alerts would be issued with a lag of several hours and could stay in place long after peak particle levels had subsided.
This was the first automated air pollution alert system in Australia. The AQI served NSW well through many significant air pollution events (e.g. Red Dawn dust storm 2009, Blue Mountains fires 2013, hazard-reduction burns in 2015–16, Kooragang Island fire 2019). It also expanded over time to include regions such as the upper Hunter (2010), Northern Tablelands (2018) and the Southern Tablelands (2019).
Table 1 : The Sydney Pollution Index (1978–94) and Regional Pollution Index (1994–2008).
| Regions | Pollutant | Categories/Thresholds | ||
| SPI - Sydney | O3 (1 hr) Visibility (1 hr) |
Low (60 ppb) |
Medium (61–120 ppb) |
High (>120 ppb) |
|
Low (1 bsp) |
Medium (1–2 bsp) |
High (>2.1 bsp) |
||
| RPI - Sydney, Lower Hunter, Illawarra | O3 (1 hr) Visibility (1 hr) NO2 (1 hr) |
Low (50 ppb) |
Medium (51–100 ppb) |
High (>100 ppb) |
|
Low (1 bsp) |
Medium (1–2 bsp) |
High (>2.1 bsp) |
||
|
Low (60 ppb) |
Medium (61–120 ppb) |
High (>120 ppb) |
||
Table 2: The NSW Air Quality Index (2008–20).
| Regions | Pollutant | Categories/Thresholds | |||||
| Sydney (3 locations), Lower Hunter, Upper Hunter, Illawarra, Central Coast, Northwest Slopes, Southwest Slopes, Central Tablelands | O3 (1 hr) | V.G 0–33 ppb |
G 33–66 ppb |
F 66–100 ppb |
P 100–150 ppb |
V.P 150–200 ppb |
H 200+ ppb |
| O3 (4 hr) | V.G 0–27 ppb |
G 27–54 ppb |
F 54–80 ppb |
P 80–120 ppb |
V.P 120–160 ppb |
H 160+ ppb |
|
| Visibility (1 hr) | V.G 0–0.7 Mm–1 |
G 0.7–1.4 Mm-1 |
F 1.4–2.1 Mm-1 |
P 2.1–3.2Mm-1 |
V.P 3.2–4.2Mm-1 |
H 4.2+ Mm-1 |
|
| PM2.5 (24 hr) | V.G 0–8.3 µgm-3 |
G 8.3–16.5µgm-3 |
F 16.5–25.0µgm-3 |
P 25–37.5µgm-3 |
V.P 37.5–50µgm-3 |
H 50+ µgm-3 |
|
| PM10 (24 hr) | V.G 0–16.5 µgm-3 |
G 16.5–33µgm-3 |
F 33–50 µgm-3 |
P 50–75 µgm-3 |
V.P 75–100 µgm-3 |
H 100+ µgm-3 |
|
| NO2 (1 hr) | V.G 0–40 ppb |
G 40–80 ppb |
F 80–120 ppb |
P 120–180 ppb |
V.P 180–240 ppb |
H 240+ ppb |
|
| SO2 (1 hr) | V.G 0–66 ppb |
G 66–133 ppb |
F 133–200 ppb |
P 200–300 ppb |
V.P 300–400 ppb |
H 400+ ppb |
|
| CO (8 hr) | V.G 0–3.0 ppm |
G 3.0–6.0 ppm |
F 6.0–9.0 ppmP |
P 9.0–13.5 ppm |
V.P 13.5–18 ppm |
H 18+ ppm |
|
V.G = very good, G = good, F = fair, P = poor, V.P = very poor, H = hazardous
From 2014, air pollution forecasts also matured with the development of the NSW Air Quality Forecasting Framework. The framework expanded the forecasting of particle pollution and added statistical models, chemical transport modelling and trajectory and plume modelling (for incidental emissions) to the forecasting system.8
Air quality categories and the current alert system
The Black Summer bushfires led to substantial changes to presenting air quality data and communicating health advice. During the bushfires, in response to community feedback, NSW began reporting hourly averages of PM10 and PM2.5, replacing the rolling 24-hour average. This provided up-to-date reporting of smoke impacts and made alerts more effective. Following the bushfires, a major review of the AQI and air quality health messaging was conducted.9 It examined how AQIs were reported nationally and internationally, with particular focus on particle measurements.
In November 2020, the AQI was replaced with the Air Quality Category10 (AQC), together with the introduction of a new health activity guide (Table 3). Like the AQI, the AQC is based on the concentrations of criterion air pollutants as well as visibility. This approach reduced the number of air quality categories and changed the thresholds for some pollutants. A new health activity guide11 provides detailed information on how people can protect themselves from air pollution and messaging targets at-risk people as well as the general population.
Table 3: The current NSW air quality categories.
| Regions | Pollutant | Categories/Thresholds | ||||
| Sydney, Lower Hunter, Upper Hunter, Illawarra, Central Coast, Lake Macquarie, Northwest Slopes, Southwest Slopes, Central Tablelands, Mid-North Coast | O3 (1 hr) | G 0–66 ppb |
F 67–100 ppb |
P 100–150 ppb |
V.P 150–200 ppb |
E.P 200+ ppb |
| O3 (4 hr) | G 0–54 ppb |
F 54–80 ppb |
P 80–120 ppb |
V.P 120–160 ppb |
E.P 160+ ppb |
|
| Vis. (1 hr) | G 0–1.5 Mm-1 |
F 1.5–3.0 Mm-1 |
P 3.0–6.0 Mm-1 |
V.P 6.0–18.0 Mm-1 |
E.P 18+ Mm-1 |
|
| PM2.5 (1 hr) | G 0–25 µgm-3 |
F 25–50 µgm-3 |
P 50–100 µgm-3 |
V.P 100–300 µgm-3 |
E.P 300+ µgm-3 |
|
| PM10 (1 hr) | G 0–50 µgm-3 |
F 50–100 µgm-3 |
P 100–200 µgm-3 |
V.P 200–600 µgm-3 |
E.P 600+ µgm-3 |
|
| NO2 (1 hr) | G 0–80 ppb |
F 80–120 ppb |
P 120–180 ppb |
V.P 180–240 ppb |
E.P 240+ ppb |
|
| SO2 (1 hr) | G 0–133 ppb |
F 133–200 ppb |
P 200–300 ppb |
V.P 300–400 ppb |
E.P 400+ ppb |
|
| CO (8 hr) | G 0–6.0 ppm |
F 6.0–9.0 ppm |
P 9.0–13.5 ppm |
V.P 13.5–18 ppm |
E.P 18+ ppm |
|
G = good, F = fair, P = poor, V.P = very poor, E.P = extremely poor
Figures 1 and 2 are examples of current alert messages using the AQI and the AQCs.
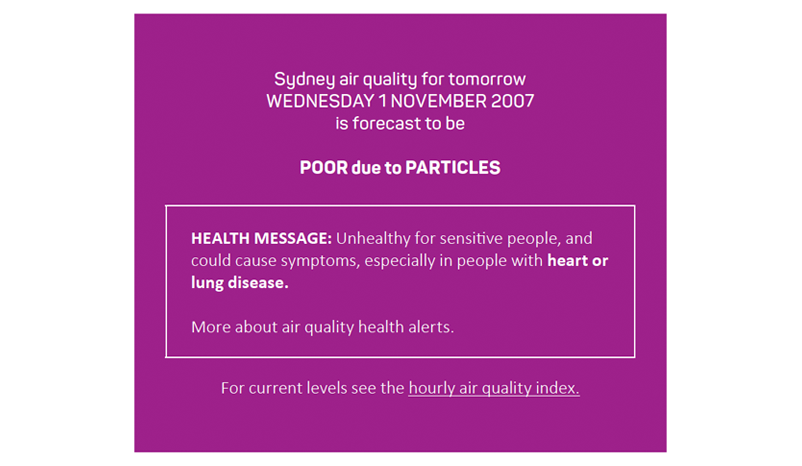
Figure 1: Example of air pollution alert using the Air Quality Index.
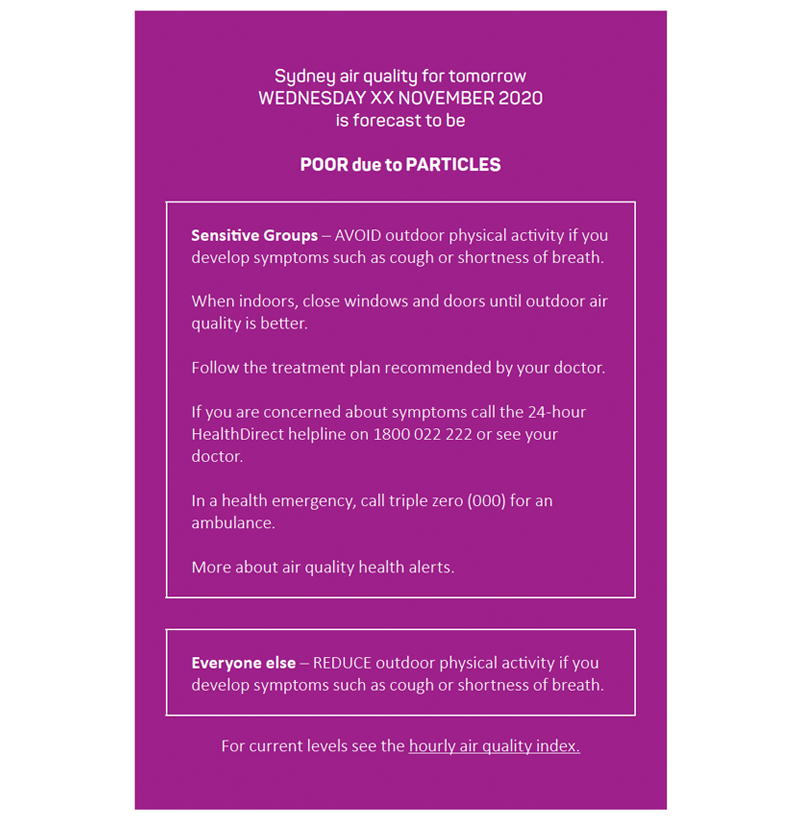
Figure 2: Example of air pollution alert using the Air Quality Categories.
Next steps
The NSW Government continues to work with other jurisdictions to improve health messaging for pollutants such as PM10 and ozone. There are currently proposed changes to the national air pollution standards for ozone, nitrogen dioxide and sulfur dioxide. The government will incorporate changes to the AQC and alert system as soon as practical after the new standards are gazetted. The overall messaging and communication about air quality issues will be improved. This will assist people to be better informed about the effects of air pollution and how the NSW alert system can help them to minimise exposure.