Lessons from the April 2015 Dungog flood
Stephen Yeo, Director of Flood Focus Consulting Pty Ltd
Article
In April 2015 the Bureau of Meteorology warned of an East Coast Low that was to affect coastal NSW bringing intense rainfall and likely flooding. This system led to record depths of inundation with devastating effects in Dungog, a small township located at the junction of Myall Creek and the Williams River in the Hunter Valley. This paper offers some early reflections on the tragedy from a flood risk management perspective, aiming to build resilience to future floods in Dungog and beyond.
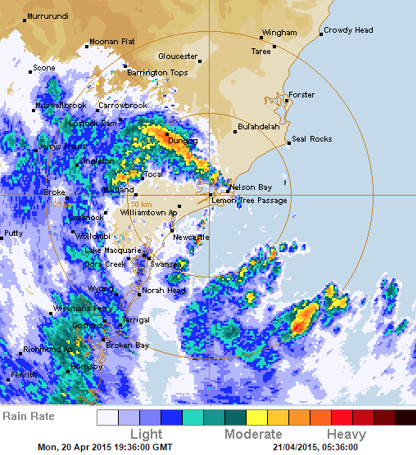
Radar image of intense rain over Dungog, 21 April 2015. Source: Bureau of Meteorology website, www.bom.gov.au.
Floodwater in Dungog rose to record levels in the pre-dawn hours of Tuesday 21 April 2015. Some 80 dwellings were flooded (representing about eight per cent of the town’s housing stock). Four houses were destroyed and three people drowned in their dwellings. Based on Australia’s National Emergency Risk Assessment Guidelines (NEMC 2010), three fatalities in a population of about 2100 represents a catastrophic consequence.
There is something particularly disconcerting about drownings in houses. Most fatalities associated with flooding in Australia result from people actively entering floodwaters. This problem demands increased investment so people better understand the risk of this activity (Keys & Gissing 2015). But what we might call ‘passive’ fatalities (cf. Yeo 2011) are unsettling because there is an expectation that people ought to be safe in their homes. Thus, flooding of dwellings raises deep-seated questions about land-use planning and emergency response.
There is also something especially troubling when those recognised as being more vulnerable are not protected. The three flood victims at Dungog were aged 79, 72 and 68. One was a resident in Alison Court, a Council-owned assisted-living complex. Another lived in a block of units where five others were rescued. The Dungog death toll could have been worse had residents not assisted in rescuing neighbours. For example, these five elderly residents were found standing on the handrails of their units holding onto the roof above them with the water up to their shoulders. They were rescued by a man using a wheelie bin as a flotation device.
It is imperative that the causes of this tragedy are identified and steps taken to reduce the risk of reoccurrence. At the time of writing, a coronial inquiry is under way that may contribute towards this end. The lessons offered are not necessarily novel—many having been identified after floods in eastern Australia in 2010 to 2012—but their reiteration underscores their ongoing application.
- Risk assessment is vital, including for local catchments and for rare events. Building development in Dungog has proceeded without a full comprehension of the modes and scale of flooding. While the Williams River Flood Study (BMT WBM 2009) defined flood behaviour for the Williams River at Dungog, the scenario that occurred in this event (short-duration flooding of Myall Creek, compounded by severe local overland flows) was not modelled. The one per cent Annual Exceedance Probability1 (1% AEP) Williams River flood level is now known to be 0.6m below the 1% AEP Myall Creek flood level at Alison Court (Figure 1). Prior to the flood the full scope of potential flooding was not well understood.
Figure 1: Flood levels at Alison Court.
AEP = Annual Exceedance Probability; AHD = Australian Height Datum; FPL = flood planning level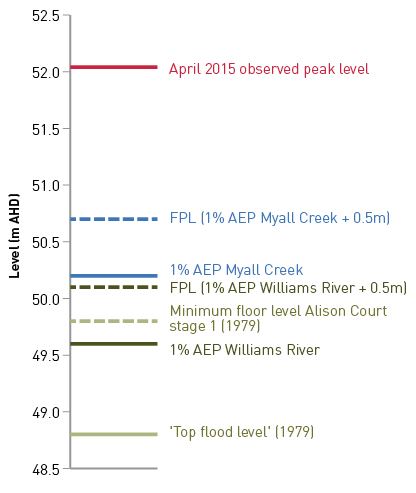
Data sources: BMT WBM (2009, 2015); Dungog Shire Council. - We need to do better at managing the risk from extreme events. Post-flood modelling indicates that this was a rare flood, with peak flows in Myall Creek less frequent than 0.2% AEP (BMT WBM 2015). Flooding in Dungog was observed from 11.30 pm on Monday. Buildings in Hooke Street were flooded from 3.30 am on Tuesday. Then a huge downpour of 146mm of rain fell in Dungog in the hour from 5.15 am to 6.15 am on Tuesday, calculated as more than two times the 1% AEP rainfall based on 1987 Intensity-Frequency-Duration estimates (BMT WBM 2015). The runoff from this intense downpour backed up behind the road and rail bridges over Myall Creek and resulted in fast-rising inundation of many houses up to their ceilings. A search of newspapers going back to the 1840s suggests that this flood reached record depths. The community had no recollection of such flooding and events proved that they were ill-prepared for this rare flood event.
- Land-use planning needs to take a greater share of the flood risk management load.
- Alison Court was approved in 1979 and constructed in the 1980s, when knowledge about flooding and planning controls were less advanced—the minimum floor level was set at only 49.8m Australian Height Datum (AHD) (Figure 1). So the tragedy was associated with a decades-old legacy of floodplain development. But an examination of the current (2003) Dungog Development Control Plan (DCP) raises a few concerns. Housing for aged or disabled people is categorised as standard residential use. Best practice teaches that because of the physical constraints affecting many older people, dwellings for senior citizens should be subject to a greater degree of control. Other council DCPs recognise housing for seniors as a ‘sensitive’ land use that is inappropriate within the 1% AEP flood extent and should only be permitted in other parts of the floodplain if certain controls are satisfied, including floor levels no lower than the Probable Maximum Flood2 (PMF) level and the provision of evacuation egress.
- The observed depths and short warning times in the April 2015 flood commend higher standards for general housing too. This was made more difficult for NSW local government areas by the introduction in 2007 of a Guideline on Development Controls on Low Flood Risk Areas, which directed councils to adopt the 1% AEP flood as the Flood Planning Level unless there were ‘exceptional circumstances’. In effect this established a default position where the planning system may be used to manage flood risks for residential uses only up to the 1% AEP plus 0.5m freeboard level leaving the residual risk associated with flooding up to the PMF to be managed through emergency response (i.e. flood warnings, evacuation planning, education). This does not adequately recognise that the residual risk varies between floodplains because flood frequency is a poor measure of risk. For some floodplains, events only slightly rarer than a 1% AEP flood could be very much more hazardous in terms of depths, velocities and evacuation constraints. The other inherent problem with this approach is that it lays too much responsibility on emergency response operations. As the Dungog flood makes clear, there is no guarantee that everyone can be rescued by responders on every occasion.
- Flash flood warning systems require further development. There was four days warning of the East Coast Low. A Flood Watch and a Severe Weather Warning for heavy rain were issued on Monday morning, and a Flood Warning specific for the Williams River at Dungog was issued at midnight Monday. But none of these provoked the responses required. The Emergency Alert system has the capability of issuing text or voice messages to householders in Dungog in one minute, and one wonders whether this could have been activated when flooding inundated buildings from 3.30 am. The impression is that chains of command for approval to issue emergency alerts need to be short-circuited for such time-critical scenarios.
- Good flood plans are just one prerequisite for a good response. Steve Opper, formerly of NSW SES, recognised that ‘even well-written plans are dependent on human application and often rely on technical support systems and cannot be guaranteed to work every time and for all circumstances in which a flood may occur’ (NSW SES 2003). At Dungog, the local flood plan accurately identifies the flood risk ‘hot spots’, including Alison Court. But this hot spot was not attended and residents were generally dissatisfied with the official response. A number of factors appeared to undermine the response:
- An earlier flood emergency at the village of Stroud prompted the deployment of NSW Fire and Rescue and NSW Police Force personnel from Dungog to Stroud, depriving Dungog of responders when its flood crisis escalated after 5.00 am.
- Only four NSW SES volunteers were available at Dungog to assist with evacuations and rescues out of a total membership of eight. This is compared to 40 volunteers who assisted during the 1990 flood. This erosion of the volunteer base means there simply wasn’t the resources to monitor flood levels, warn the public, and attend to all the time-critical rescues that arose.
- Another potentially disruptive factor was the recent retirement of the previous Local Controller in January 2015. In general, the loss of a long-time leader can result in a loss of institutional knowledge. It can also deprive an organisation of valuable operational experience as younger members have less hands-on practice of real events.
- Flooding of local roads within Dungog prevented access to some trouble spots.
- Lack of communications disrupted the emergency response. Telephone landline and mobile services went down at 7.00 am on Tuesday (this was after the fatalities occurred).
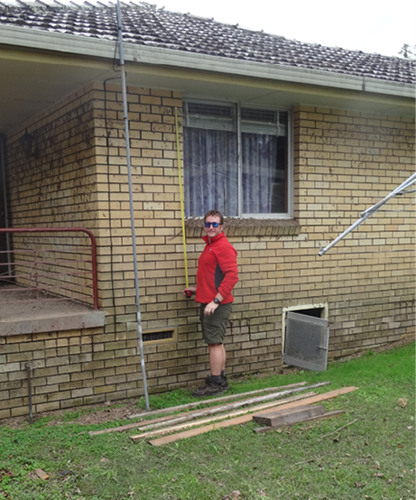
Many dwellings in Dungog were flooded to ceiling level, including these units in Brown Street. Image: Chas Keys.
The April 2015 flood in Dungog taught that whether because of the scale and speed of the event, split resources, inadequate numbers, leadership transitioning, local road closures and communications difficulties, emergency services organisations cannot be guaranteed to rescue everyone in need of rescue. Sustaining the capability of emergency services to respond well over the sometimes long periods between floods requires good plans, local ownership of those plans, scenario testing, organisational renewal, and smooth transitions in leadership.
Still, Murphy’s Law may conspire to foil an operation and place the onus of saving lives directly on the exposed population. Most people find it difficult to comprehend floods higher than they have experienced. Overcoming this remains a great challenge for community flood education. And some people are unable to self-evacuate, emphasising again the primary role of locating the right land use in the right place, and requiring housing designs that safeguard lives even in extreme events.
| Acknowledgements
This article is an abridged version of a longer research report (Yeo 2015), sponsored in part by Risk Frontiers. Special thanks are extended to Chas Keys who reviewed this article and to Andrew Gissing who provided insightful comment during this work. |
References
BMT WBM 2009, Williams River Flood Study, prepared for Port Stephens Council and Dungog Shire Council, June 2009.
BMT WBM 2015, Post Event Flood Behaviour Analysis and Review of Flood Intelligence, Dungog Township, Myall Creek Catchment and Tributaries, Draft Report, prepared for Office of Environment and Heritage, July 2015.
Keys C & Gissing A 2015, More than 70 deaths in five years: we need more education on the dangers of floodwaters, The Sydney Morning Herald. At: www.smh.com.au/comment/more-than-70-deaths-in-five-years--we-need-more-education-on-the-dangers-of-floodwaters-20150505-1na6vg.html [5 May 2015].
National Emergency Management Committee (NEMC) 2010, National Emergency Risk Assessment Guidelines, Tasmanian State Emergency Service, Hobart.
NSW SES 2003, DA’s, Flood Risk and Site Specific Evacuation Plans, NSW SES State Headquarters, Wollongong. At: www.kempsey.nsw.gov.au/council/meetings/2003/2003-12-09/pubs/2003-12-09-de-app-a.pdf.
Yeo S 2011, Flood fatalities in Fiji, 2000-2009, in Collen J & Bukarau L (eds.) Abstracts of Papers Presented at the STAR Session 2011, SPC SOPAC Division Published Report 26, SOPAC, Suva, p. 37.
Yeo S 2015, Land use planning, emergency management and risk perception: reflecting on the Dungog flood of April 2015, Flood Focus Consulting, Sydney.
Footnotes
1 The AEP is the likelihood of occurrence of a flood of a given size in any one year, usually expressed as a percentage. For example, if an event has an AEP of one per cent, it means that there is a one per cent risk (i.e. likelihood of 1-in-100) of it occurring in any one year.
2 The Probable Maximum Flood is the maximum flood that is reasonably estimated to not be exceeded.