National meteorological and hydrological services provide severe weather warning information to inform decision-making by emergency management organisations. Such information also helps communities to take defensive and mitigating actions prior to and during severe weather events. Globally, warning information issued by meteorological and hydrological services varies widely. This can range from solely hazard-based to impact-based forecasting encompassing the exposure and vulnerability of communities to severe weather. The most advanced of these systems explicitly and quantitatively model the impacts of hazards on affected assets or infrastructure such as vehicle traffic or housing. Incorporating impact information into severe weather warnings contextualises and personalises the warning information, increasing the likelihood that individuals and communities will take preparatory action. However, providing useful and detailed impact information remains a challenge. This paper reviews a selection of current severe weather warnings and impact forecasting capabilities globally and highlights uncertainties that limit the forecasting and modelling of multi-hazard events.
Introduction
The cost of severe hydrometeorological weather events is substantial (e.g. Kousky 2014), encompassing injury, loss of life, displacement, inhibiting access to services and causing extensive damage to property, infrastructure and the natural environment. Infrastructure expansion due to increasing population and urbanisation increases the potential for disruption from severe weather events. Changing weather conditions, such as the intensification of severe weather under climate scenarios, expose communities that may have had little prior experience with these events, making them more vulnerable (Wuebbles et al. 2014, Venner & Zamurs 2012). However, despite multi-day prediction of severe weather events and the dissemination of warnings by national meteorological and hydrological service (NMHS) forecasters, there remains a disparity between warning information and the likelihood of the community taking action to defend against or mitigate the potential effects of associated hazards (WMO 2015). One of several contributing factors is ‘impact forecasting’ that helps bridge the divide between forecasts of hydrometeorological events and mitigation action taken by emergency management organisations, communities and individuals by translating forecast hazard information into ‘forecast impacts’ at various scales (WMO 2015). A hazard-only warning may forecast a severe thunderstorm with damaging winds and heavy rainfall. Specifying that expected winds will damage trees and powerlines incorporates community vulnerability. Localised knowledge and exposure data can flag potential road closures and traffic delays. To ensure accurate, localised impact information in impact forecasting, a high level of coordination and knowledge sharing is required between meteorological agencies, custodians of exposure and vulnerability information and other stakeholders (Anderson-Berry et al. 2018; Taylor, Kox & Johnston 2018).
A recent study comparing the impacts of two storm systems with similar characteristics on the New York City region found that impact-based decision-support services used in response to one event improved decision-making, enhanced inter-agency communication and reduced societal and economic effects (Lazo et al. 2020). They estimated that impact-based services reduced costs to the aviation industry by over USD$17 million, reduced recovery time for ground transport by 5 days and saved over USD$90 million for the energy sector. A number of other studies have found that including impact information within warnings leads to improved community understanding and response (e.g. Kox, Lüder & Gerhold 2018; Weyrich et al. 2018; Ripberger et al. 2015; Harrison et al. 2014). In these studies, severe weather warnings encompassing the probability of occurrence and expected impacts were generally considered by end users (including emergency managers, broadcast media and the public) to be more useful than traditional hazard-based methods. In contrast, in a hypothetical study, participants were given hazard- and impact-based warning information but were only slightly more likely to take defensive or mitigating actions (Potter et al. 2018). However, even in this study, impact-based warnings were strongly associated with greater understanding, threat perception and concern about an event. The importance of personalising warning information and conveying risk motivated the issuance of a recommendation that emergency services organisations shift from hazard-based to impact-based warning systems (WMO 2015).
Impact-based forecasts and warnings exist along a spectrum of levels of sophistication. At the lower end, maps of hazard predictions are simply relabelled as impact categories (Pacific Disaster Center 2018). More sophisticated approaches relate impact to the climatological frequency of a specific predicted hazard magnitude or parameterise vulnerability through proxies such as population density (e.g. Robbins & Titley 2018). At the upper end of the spectrum, hazard-impact models incorporate detailed specifications of vulnerability and exposure to qualitatively or quantitatively derive the impact resulting from a hazard (Hemingway & Robbins 2018).
Despite its utility, impact forecasting is a relatively new field of modelling and efforts towards this goal vary widely. For example, while many European meteorological and hydrological services are currently transitioning to impact-based criteria from fixed or climatology-based hazard thresholds, almost 70 per cent of these do not run impact models for the production of impact-based warnings (Kaltenberger, Schaffhauser & Staudinger 2020). The same study notes that this could be due to issues relating to cost, a lack of impact data and verification, which makes it difficult to assess the performance of impact models under development.
This paper reviews the current status of impact-based forecast and warning guidance globally. Longer-range risk assessment tools (such as catastrophe-loss models) are excluded to focus on the shorter-range (less than 2 week) guidance. The focus is on impact systems relevant to emergency management and, as such, does not consider recent developments in the business sector. Examination of the details of the systems and their utility from a user-perspective is beyond the scope of this paper. The current state of impact models, which aim to explicitly forecast the effects of severe weather, are included. Gaps are highlighted for future investigation and provide suggestions to reduce the uncertainties in impact modelling.
Fundamentals and uncertainties in impact forecasting
The probability of impact from a hazard is the intersection of the likelihood of the hazard and the vulnerability and exposure of an individual, community or asset to the hazard (Figure 1). Hydrometeorological forecast uncertainty allows the estimation of the likelihood of the hazard, most often through the use of ensemble prediction systems (EPSs). In EPSs, multiple numerical weather prediction (NWP) model runs (termed members) with varying initial conditions and/or physics parameterisation schemes form an ensemble forecast. Ensemble forecasts provide an indication of the confidence in the overall forecast through the spread between the individual ensemble members, with a small (large) spread indicating less (more) uncertainty in the atmospheric conditions (Gneiting & Raftery 2005). Thresholds on probabilistic forecasts derived from EPS can be set to alert forecasters and other users to the likelihood of a hazard occurring, which can substantially increase the lead time of useful forecasts for end users.

Figure 1: Venn diagram showing impact as the intersection of a hazard and the vulnerability and exposure of individuals, communities and assets to the hazard.
Uncertainties also exist in the exposure and vulnerability components. For our purposes, exposure describes people, property, infrastructure or other elements exposed to a particular hazard during an event. Where information regarding an individual building is not available, missing exposure data can be statistically inferred using known attributes of geographically similar regions. However, this introduces uncertainty into the exposure information. National, state or local standards are often not applied consistently for capturing and maintaining individual building attributes. Due to the sheer size of Australia, data is collated at different scales for different purposes and captured over extended periods of time, which also contributes to different levels of uncertainty across the country.
Vulnerability describes the degree to which a building (or other exposed element) is damaged by a given intensity of hazard, with different hazard-specific relationships applicable to different types of assets. Uncertainty in vulnerability arises from many sources such as variation in asset types, the magnitude of the causative hazard (which often cannot be directly measured and must instead be estimated from numerical reconstructions) and the level of defensive or mitigating action taken.
Finally, the term ‘impact’ is used to refer to a wide range of consequences from a hazard including physical damage, disruption, denial of services and more. One example of quantifying physical impacts is the damage index, which is the ratio of repair cost to replacement cost for the asset (Wehner et al. 2010).
Impact forecasts and warnings from hazard mapping
Basic impact forecasts incorporate vulnerability and exposure information into hazard forecasts.
Climatology-based
The likelihood of occurrence of hazardous weather phenomena during a forecast window can be estimated using exceedance probabilities of climatology-based hazard thresholds. A noteworthy example is the UK Met Office Decider forecast product that allocates each member of a long-range ensemble forecast (one week and beyond) to the closest match from a set of 30 predefined weather regimes (Neal et al. 2016). Probabilities are calculated to deduce the regime with the highest likelihood of occurrence and exceedance of climatological hazard thresholds for any given location within the forecast range. Probabilistic methods such as this exploit known (historical) severe weather impact statistics for a range of synoptic weather patterns. This allows for the provision of multi-week probabilistic impact forecasts based on no more than a comparatively robust prediction of these larger-scale weather patterns.
Impact-based
While the climatology-based approach estimates only hazard, overlaying hazard forecasts onto proxies for exposure and vulnerability extends hazard forecasts towards impact estimation. A common type of hazard-based forecast uses geospatial maps depicting the probability of occurrence of a hazard, using symbols and colour-coding for ease of interpretation by forecasters or end users. For example, the Pacific Disaster Center DisasterAWARE Early Warning and Decision Support Platform (2018) produces real-time global geospatial maps of a range of hazards including tropical cyclones, high winds, severe storms and floods (Figure 2).
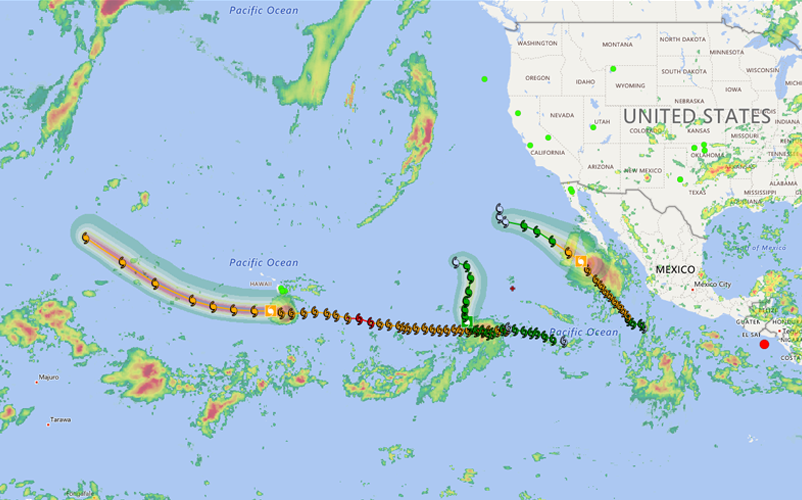
Figure 2: A snapshot of the Pacific Disaster Center global hazard map over the central and eastern Pacific Ocean (taken at 04:49 UTC 9 August 2018 from the publicly available version of the Pacific Disaster Center DisasterAWARE hazard mapping product).
The red-filled circle in Figure 2 denotes an earthquake of magnitude greater than 5 on the Richter scale. The green-filled circles denote earthquakes of a magnitude between 2 and 4. Three current tropical cyclones locations (squares with a white cyclone symbol inside) are shown south of Hawaii, between Hawaii and Mexico, and just west of the Baja California Sur in the eastern Pacific. Tropical cyclone intensities, using maximum sustained wind speeds, are colour-coded below 40 miles per hour (mph) in blue, 40–70 mph in green, 70–150 mph in amber and in red for sustained winds in excess of 150 mph. The NASA IMERG 24-hour precipitation estimate is also shown ranging from green for light rainfall through to red for intense rainfall.
Spatial hazard probability forecasts can also be overlaid directly onto exposure information. This maps the assets that will be exposed to the hazard. Examples include the US National Oceanic and Atmospheric Administration Storm Prediction Center Convective Outlook (2018) and the Met Office Global Hazard Map (GHM) (Robbins & Titley 2018). The GHM allows the layering of antecedent conditions (such as rainfall and soil moisture) and vulnerability and exposure data (using proxies such as population density, age of housing and socio-economic status) to determine the likely impact. Unlike impact models, layered impact guidance products such as these leave it to the user to combine the individual layers of hazard, exposure and vulnerability information into an impact estimate.
Early warning systems
Impact-based severe weather warnings across many agencies and countries use a matrix similar to that implemented by the UK Met Office (Figure 3). This system estimates the impact of a hazard through the severity and likelihood of occurrence using 4 colour categories indicating ‘very low’, ‘low’, ‘medium’ and ‘high’ (Neal et al. 2014). For example, the MOGREPS Warnings tool (MOGREPS-W) presents the probability of occurrence of a weather event (severe wind, rain, snow, fog and ice) at individual grid-points using the colour scheme of the impact matrix. The impact thresholds vary between counties to localise the warning level to the vulnerability and exposure of individual counties. The Network of European Meteorological Services product, Meteoalarm (2018), uses the same colour framework to colour-code and overlay hazard symbols on administrative and geographical regions, from an international to national and regional scales. Other examples include the colour-coded regional maps of the Météo-France Vigilance Early Warning System (Borretti, DeGrace & Cova 2012; Kolen, Slomp & Jonkman 2013) and the Shanghai Multi-Hazard Early Warning System platform (Tang et al. 2012).
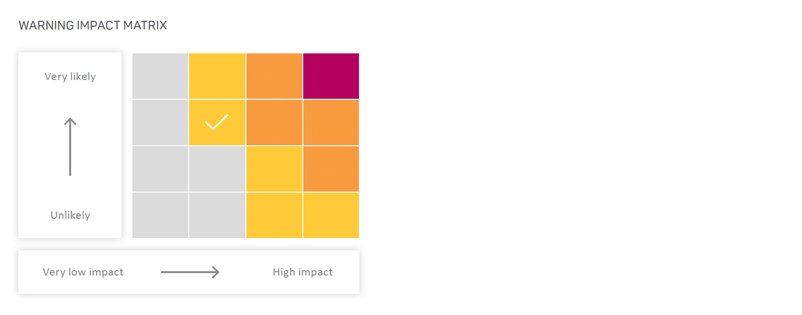
Figure 3: UK National Severe Weather Warning Service Impact Matrix (Neal et al. 2014).
Quantitative impact modelling
The examples presented demonstrate the common use of spatial hazard mapping among hydrometeorological agencies. However, few systems integrate vulnerability and exposure information and those that do typically do so as additional ‘layers’ that must be interpreted by the user. More complex models directly forecast the impact of hazards on a community or a sector of interest. The insurance and reinsurance industries have developed vulnerability measures and impact (or catastrophe) models to predict loss and damage to the built environment from severe weather events using a financial perspective (e.g. Dunn et al. 2018). The challenge for hydrometeorological modelling is to translate impact information into tangible information that can be used (such as in emergency management planning) in a real-time operational environment (Hemingway & Gunawan 2018). This challenge, despite its importance, is being considered by relatively few agencies across the world. One example is the UK Natural Hazards Partnership, in which hazard-impact models are developed to support operational impact forecast decision-making (Hemingway & Gunawan 2018). In Australia, a partnership between the Bureau of Meteorology and Geoscience Australia is developing a prototype hazard-impact model for east coast lows.
Surface water flooding hazard-impact model
The surface water flooding hazard-impact model developed within the UK Natural Hazards Partnership uses operational ensemble rainfall forecasts as input into a hydrological model. This produces probabilistic surface runoff forecasts as the hazard for input into a pre-calculated Impact Library (Aldridge et al. 2016). The maximum impact is determined from 4 categories:
- danger to life
- damage to the built environment
- denial of access to key sites or infrastructure
- damage to transport networks.
The maximum surface water runoff during a given period is calculated and compared with flood spatial datasets to produce a map of potential flood impacts (Figure 4).
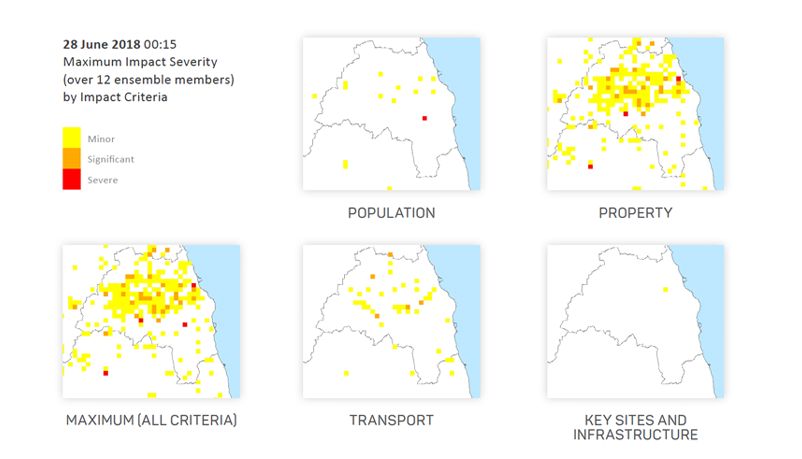
Figure 4: An example of the surface water flooding hazard-impact model for an ensemble rain forecast at every 1 km grid cell over Durham County in north-east England (Aldridge et al. 2020). The bottom left panel shows the maximum impact across components in each grid cell.
The impact severity for each county is determined by whether the proportion of cells affected exceeds a given threshold. By repeating across the entire ensemble, the model provides guidance on both the likelihood and the potential impact severity of surface water flooding at a county scale. A flood-risk matrix, similar to Figure 3 (Flood Forecasting Centre 2017) is then used to assess the highest overall surface water flood risk (e.g. Figure 5).
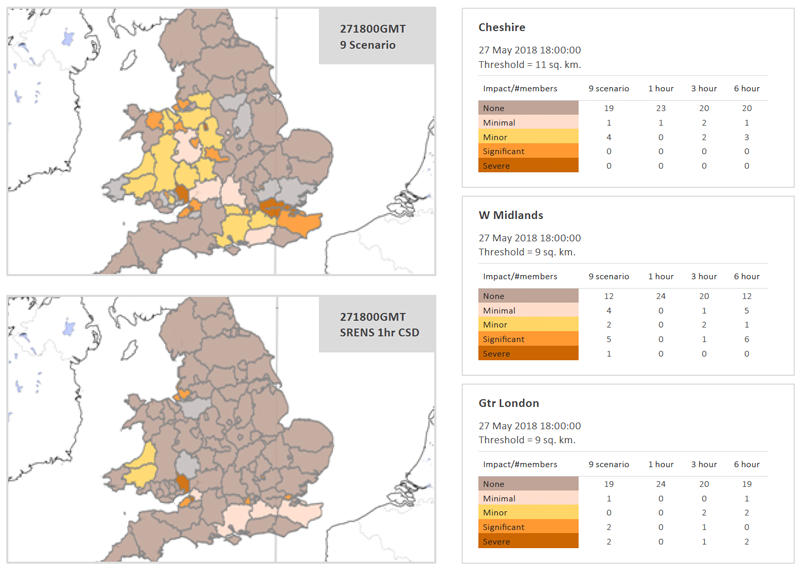
Figure 5: A surface water flooding hazard-impact model of county level summary impacts for an ensemble rain forecast (R. Cowling 2018, personal communication, 6 June).
Severe wind hazard-impact models
Under the UK Natural Hazards Partnership, the UK Met Office is developing the Vehicle OverTurning model, the Camping and Caravanning model and the Bridge model (Hemingway & Gunawan 2018). The (currently) pre-operational Vehicle OverTurning model takes operational ensemble forecasts and calculates the probability that wind gusts will exceed vehicle-specific thresholds at sections of the road network. Vulnerability depends on several factors, for example, altitude of a road sector, number of lanes (multi-lane roads are lower risk of complete closure), infrastructure (tunnels and roundabouts) and road orientation with respect to wind direction. The model is supporting UK Met Office meteorologists issuing impact-based wind warnings (Hemingway & Robbins 2020). The Camping and Caravanning model uses the same algorithm as the Vehicle OverTurning model to forecast the impact risk from high winds on campsites and large gatherings. They use seasonally dependent exposure and lower wind thresholds due to the increased vulnerability of tents and caravans. The Bridge model forecasts the effects of high winds on bridges and road states and informs decisions regarding speed restrictions and closures during severe wind events.
The Australian Bureau of Meteorology and Geoscience Australia have developed a pilot quantitative forecast model for wind impact on residential housing using hazards provided by high-resolution NWP predictions (Richter et al. 2019). The project focuses primarily on east coast lows, which are complex low-pressure systems that affect the eastern Australian coastline and are capable of producing strong winds, very heavy rainfall and storm surges (Holland, Lynch & Leslie 1987). The impact model takes building information from the National Exposure Information System (Power et al. 2017) and uses existing heuristic wind vulnerability functions for residential buildings based on tropical and extra-tropical cyclone events. The expected mean structural loss ratio due to wind is aggregated over Statistical Area level 1 (SA1) areas, which contain between 200–800 people. In this way, the forecast highlights regions expected to be most affected by an event. This can be consistently mapped and communicated to emergency services organisations. This approach is demonstrated using reanalysis surface wind gusts from high-resolution NWP (BARRA-SY, Jakob et al. 2017) shown in Figure 6. Performance assessment of the 'forecast' is currently underway and has produced encouraging preliminary results.
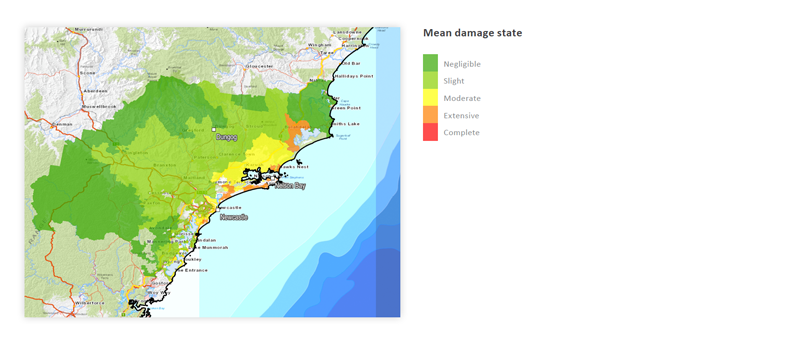
Figure 6: Results of the wind gust impact 'forecast' developed by the Australian Bureau of Meteorology and Geoscience Australia. Mean structural loss ratio (calculated for residential buildings) due to the surface (10 metres above ground level) wind gust is averaged across the area for an east coast low on 20–22 April 2015.
Current challenges in quantitative impact modelling and forecasting
The quantitative impact models forecast single-hazard impacts, whereas severe weather events such as east coast lows, usually produce multiple and compounding hazards. Difficulty isolating the dominant cause of damage (e.g. wind, water ingress or treefall) impedes the derivation of accurate vulnerability relations. If the cause of the damage cannot be identified, impact forecast verification is limited (Richter et al. 2019; Kaltenberger, Schaffhauser & Staudinger 2020).
In Australia, damage assessments are undertaken to evaluate the level of impact from a disaster. This includes assessing the physical safety of affected structures and informs recovery planning and operations (AFAC 2016). Minor changes in the collection of damage assessment data, however, can ameliorate some of the issues outlined above. One suggested change is to include connections between observed damage and the underlying hazard (e.g. wind or water ingress). A second proposed alteration is the inclusion of categorical damage ratings to a structure. The National Damage Assessment Data Set and Dictionary for Phase 2 Assessments (AFAC 2016) outlines a minimum set of attributes to standardise damage assessment data collection and reporting by Australian emergency services agencies. However, uptake across jurisdictions has been varied and has limited the utility of collected data for impact research. Indeed, recommendations 4.6 and 4.7 of the Royal Commission into National Natural Disaster Arrangements Report (Commonwealth of Australia 2020) stipulate that the collection and sharing of consistent impact data be standardised across Australian states and territories. To advance quantitative impact-based forecasts and warnings and ensure collected damage data can be used in model development and testing, close collaboration between national meteorological and hydrological services, emergency services organisations and custodians of vulnerability and exposure data is vital.
Conclusions
This study provides an overview of approaches to produce impact-based information to improve weather warnings and forecasts. Impacts can be included in a hazard forecast in a simple manner by presenting the predicted hazard magnitude within a climatological context. However, impact information can also be added through stand-alone layers of exposure or vulnerability (assets or people). This common approach is not constrained by specific damage data attributes nor their connection to the nature and magnitude of the causative hazard. However, such layers leave it to the end user to subjectively integrate the qualitative layers to obtain the final impact, and therefore lacks consistency across multiple users.
The most sophisticated impact forecasts use quantitative hydrometeorological hazard-impact models. Examples are the UK Met Office Vehicle Overturning model and an Australian pilot project assessing wind damage associated with east coast lows. These models integrate hazard, exposure and vulnerability information quantitatively to provide pointwise or spatial impact magnitudes. Hazard-impact models are rare and, because of their need to ingest quantitative impact data, are strongly reliant on the accuracy of connections between physical impacts and the underlying hazard, exposure and vulnerability. This review highlights that improved damage assessment datasets is an important first step towards improved quantitative impact modelling.