On the morning of 22 September 2021, at 09:15 Australian Eastern Standard Time, a powerful earthquake of moment magnitude MW 5.9 struck approximately 12 km to the northeast of the small village of Woods Point in the Victorian high country. This earthquake is the largest earthquake in Victoria in the instrumental era and it shook the residents of multiple localities around the epicentre, including Melbourne, where it notably caused a parapet and wall collapse, spilling debris onto Chapel Street, Windsor, among other reports of damage. The earthquake was felt across Australia’s eastern states and territories. Geoscience Australia received 43,073 community felt reports through its Earthquakes@GA1 (EQ@GA) website with reports of shaking coming from Victoria, South Australia, Tasmania, New South Wales, Australian Capital Territory and even Queensland. Nearly 76% of all felt reports were submitted within the first 24 hours of the earthquake and 45% were received within the first hour at peak rates of almost 700 responses per minute. This is the largest number of reports that Geoscience Australia has received for a single event since the reporting facility was added to the EQ@GA website in 2006.
The National Earthquake Alerts Centre
The Geoscience Australia National Earthquake Alerts Centre (NEAC) monitors for Australian and global earthquakes 24 hours a day, 7 days per week and publishes parameters for earthquakes that are within its remit, within specific timeframes and in accordance with standard operating procedures. Generally speaking, significant earthquakes2 are published to the EQ@GA website within 20 minutes of the earthquake’s origin time, which is the time the earthquake occurred (origin time), abbreviated to ‘OT’. Exceptions to this are:
- earthquakes that have the potential to generate a tsunami (i.e. tsunamigenic earthquakes) are published within 10 minutes of the earthquake’s OT (in accordance with the Joint Australian Tsunami Warning Centre Standard Operating Procedure)
- earthquakes that are not considered significant are published either within 60 minutes of the OT or on the next business day (depending on the location and other attributes).
These timelines strike a balance between the accuracy of information and the speed at which it is provided. Earthquake information (location, depth, time and magnitude) are estimates based on remotely observed data that is fitted to models of the Earth and, therefore, inherent uncertainties exist. Generally speaking, the uncertainty decreases (though it is not eliminated) as more time elapses and more data is available.
The 2021 MW 5.9 Woods Point earthquake was not tsunamigenic as it was inland and too small to cause an underwater tsunami even if it had been offshore. However, the first bulletin was released and published to the website approximately 12 minutes after the earthquake occurred (i.e. OT+12). The bulletin was expedited due to the earthquake size and the very large number of community felt reports received in the first 10 minutes after the quake, along with high levels of requests for information. The earthquake parameters were updated over the next hour.
The community felt reports received prior to the publication of the information were assigned to the earthquake immediately after its publication. Thereafter, people accessing the website were able to assign their own felt reports. Any residual unassigned reports were periodically assessed and, if appropriate, assigned to the earthquake.
The NEAC receives felt reports through the EQ@GA website in real-time. They are an invaluable resource for situational awareness in that they define where people and assets at risk are located, and how they may have been affected. They also inform Geoscience Australia’s research on the attenuation of earthquake ground shaking and allow seismic hazard assessment that can be used by emergency management planners.
Table 1: Abbreviated description of the levels of Modified Mercalli Intensity (replicated from usgs.gov). The MMI categories are marked by Roman numerals ranging from I (not felt) to X+ (extreme shaking and total destruction).

Earthquake intensity – community felt reports, FeltGrid and ShakeMap
The felt report questionnaire is accessed via the EQ@GA website and contains 15 multiple-choice questions that relate to the shaking experienced at a location at the time of the earthquake. Each response to a question is used in the equation that calculates the Modified Mercalli Intensity (MMI) at the given location (Wald et al. 1999a). A measure of MMI refers to ‘real-world’ effects experienced at a given location and is considered a more meaningful measure of the severity of ground shaking for a non-scientist than earthquake magnitude. That is, the MMI scale describes the effects of earthquakes on people, infrastructure and environment. The scale, its associated colour scheme and the descriptions of the earthquake effects are given in Table 1.
While there are a variety of factors that can influence perceived shaking, MMI values generally decrease with increasing distance from the epicentre. However, there are factors that affect this relationship. For example, sites located on unconsolidated soils and clays can amplify the propagating seismic waves relative to sites located on bedrock.
As the felt reports are received they are aggregated into gridded cells representing 20 × 20 km, 10 × 10 km, 5 × 5 km and 1 × 1 km resolution. These aggregated felt reports are collectively referred to as the FeltGrid and are displayed and updated on the website in real-time as more felt reports are received. The values provided in the felt reports within each cell are averaged and the cells are representative of average reported intensity across an area, with outlier reports of shaking (too low or too high) effectively being smoothed out. The 4 resolution levels allow emergency managers and the public to view the reported intensity by zooming in and out of the area of interest on the website. Figure 1 shows the FeltGrid at 20 × 20 km resolution. The intensity colour scale (see Table 1) indicates lighter perceived shaking in green and blue colours and stronger perceived shaking in orange and red colours, and is applicable to all subsequent maps.

Figure 1: FeltGrid at 20 x 20 km resolution for the 22 September 2021 MW 5.9 Woods Point earthquake as displayed on Earthquakes@GA website. The FeltGrid at any resolution is averaged intensity over all the felt reports in a given cell. The yellow circle in the background of the FeltGrid indicates the earthquake location and its size relates to the magnitude estimate.
In addition to the FeltGrid the EQ@GA website contains the ShakeMap for any earthquake of local magnitude MLa 3.5 or larger. ShakeMap, developed by the US Geological Survey (USGS), provides near-real-time maps of shaking intensity following significant earthquakes (Wald et al. 1999b). As such, it is a useful tool for rapidly estimating the likely impact of an earthquake in terms of ground-shaking intensity, over a broad area.
ShakeMap has been introduced by Geoscience Australia to support post-earthquake decision-making by Australian emergency management agencies (Allen et al. 2019). Geoscience Australia has adapted ShakeMap for Australian earthquake and seismic monitoring conditions and uses it to model shaking intensity from Australian earthquakes above magnitude MLa 3.5.
ShakeMap combines information from felt reports submitted by the community through the EQ@GA website with telemetered seismic data, information about the regional geology (McPherson 2017), and models that estimate ground shaking for a given magnitude and distance from the earthquake. The first ShakeMap for an earthquake is usually available within 30 minutes of the earthquake’s OT, and is regularly updated after the OT. The final version of ShakeMap for the MW 5.9 Woods Point earthquake is shown in Figure 2.
The colours shown in Figure 2 indicate modelled average intensity modified by the submitted felt reports (the colour scale is provided at Table 1). Coloured circles are locations of aggregated reports. Approximate (not measured) peak ground acceleration and peak ground velocity values for shaking categories are also listed in Figure 2 below the map (Worden et al. 2012).
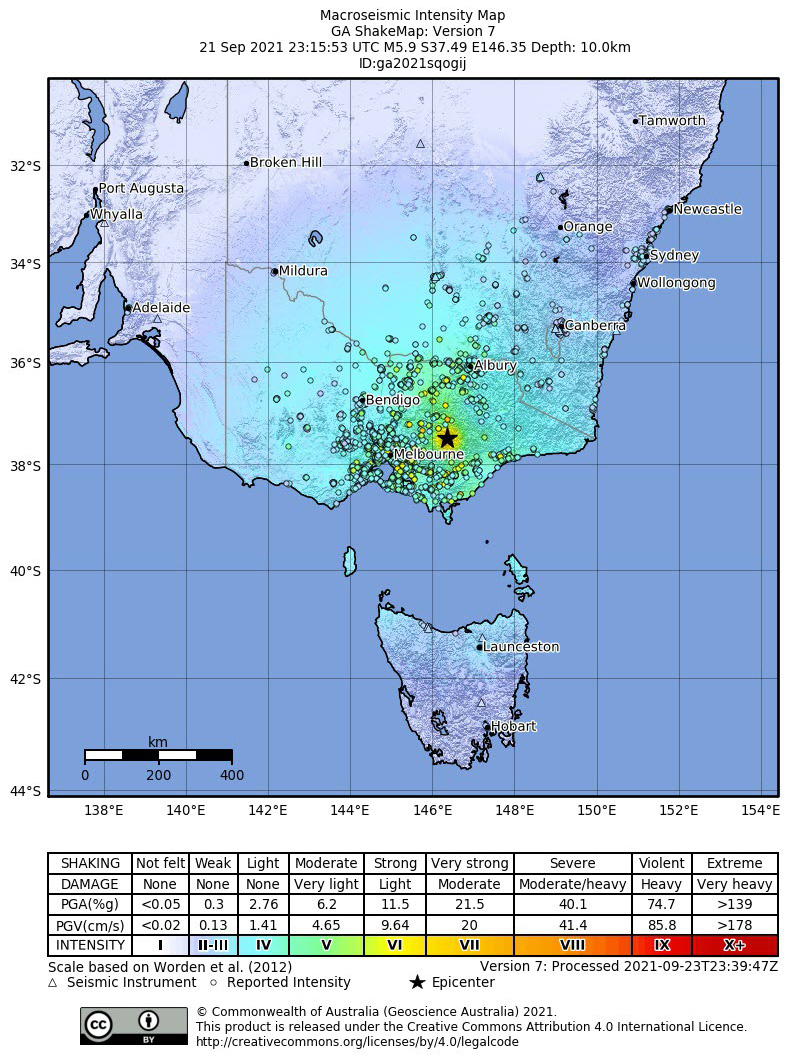
Figure 2: The ShakeMap generated 48 hours after the 22 September 2021 MW 5.9 Woods Point earthquake. The epicentre is marked by the black star.
Data
In this study, the actions taken by the members of the public during the 2021 MW 5.9 Woods Point earthquake are the focus. Individual felt reports are plotted on a map against a backdrop of the average reported MMI at 20 × 20 km resolution (shown in Figure 1). The 20 × 20 km aggregated MMI is the average shaking intensity experienced by people in that area during the earthquake and reported to Geoscience Australia.
This study used only the felt reports where consent to use the data for research purposes was given. This approval reduced the dataset to a total of 37,743 available felt reports (out of 43,073 submitted reports). The questionnaire required multiple-choice responses but also allowed respondents to answer a subset of questions using free text. The questions that could be answered or supplemented with free text included: describing the location during the earthquake, describing respondent reaction to the earthquake and adding information about respondent actions. While the information provided in free text was used for aggregation and average MMI calculation, the free-text format answers were not considered for this study when mapping the actions taken. Approximately 11% of available responses offered free-text, however, the decision to not use that data for this study allowed for simple data processing and enabled mapping and commenting on the standard responses.
When the free-text format reports were filtered out, a total of 33,715 reports were left that were used in this study.
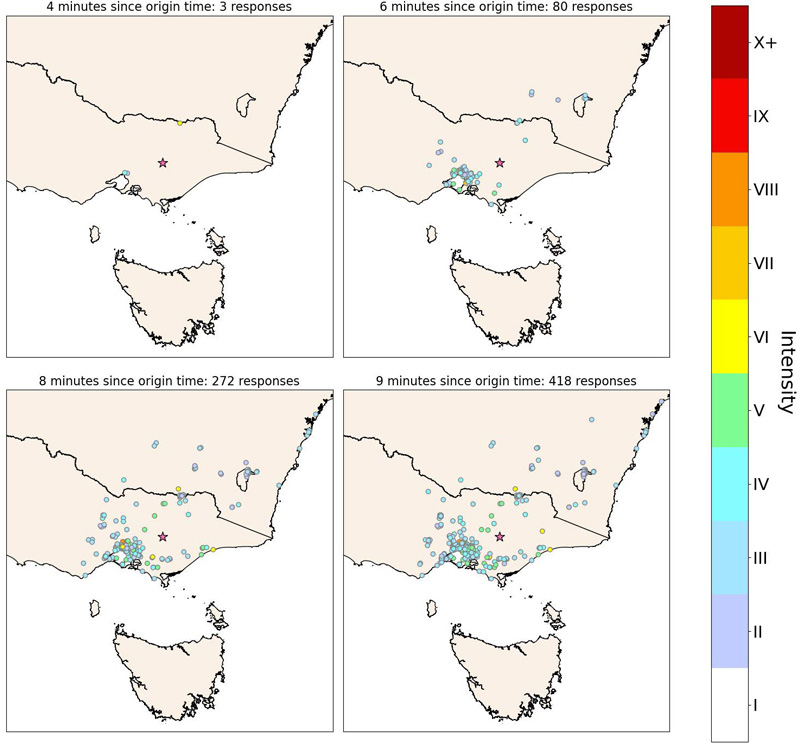
Figure 3: Number and spatial extent of community felt reports for the 22 September 2021 MW 5.9 Woods Point earthquake (epicentre marked by pink star) within 10 minutes of origin time.
Crowd-sourced data and earthquake effects
Lilienkamp et al. (2023) demonstrated that crowd-sourced felt reports can be indicators of potential effects of earthquakes in their early stages, especially in areas where instrument observations of ground shaking are few. They developed a method to assess the impacts of a large number of earthquakes on communities using felt reports alone. This approach can be used as a ‘traffic light’ system for emergency management agencies based on ‘impact scores’, when applied in real-time. Impact scores are determined from the number and the geographical extent of submitted felt reports over a given time. This will depend on the severity of the earthquake, the population density and distribution in the affected region and the level of population participation. Lilienkamp et al. (2023) indicated that receiving 50 felt reports within 10 minutes from an earthquake’s origin time (OT+10) is enough to start processing the felt report data and estimating the potential impact on localised communities.
Geoscience Australia maps, in real-time, the number and the spatial extent of submitted felt reports and the reported intensity of shaking in the FeltGrid and ShakeMap features through its EQ@GA website. Figure 3 and Figure 4 show the maps of felt reports submitted to EQ@GA within the first 10 minutes of the MW 5.9 Woods Point earthquake (i.e. prior to the earthquake information being published) and at regular intervals between 10 and 60 minutes after the earthquake, respectively. The coloured circles represent individual reported community intensities. These individual reports are averaged in the FeltGrid in real-time as new felt reports are received. Figures 3 and 4 show that the
data contains sufficient information to be used in a similar ‘traffic light’ system to that of Lilienkamp et al. (2023). Consequently, emergency managers are encouraged to use the EQ@GA website to support decision-making after an earthquake.
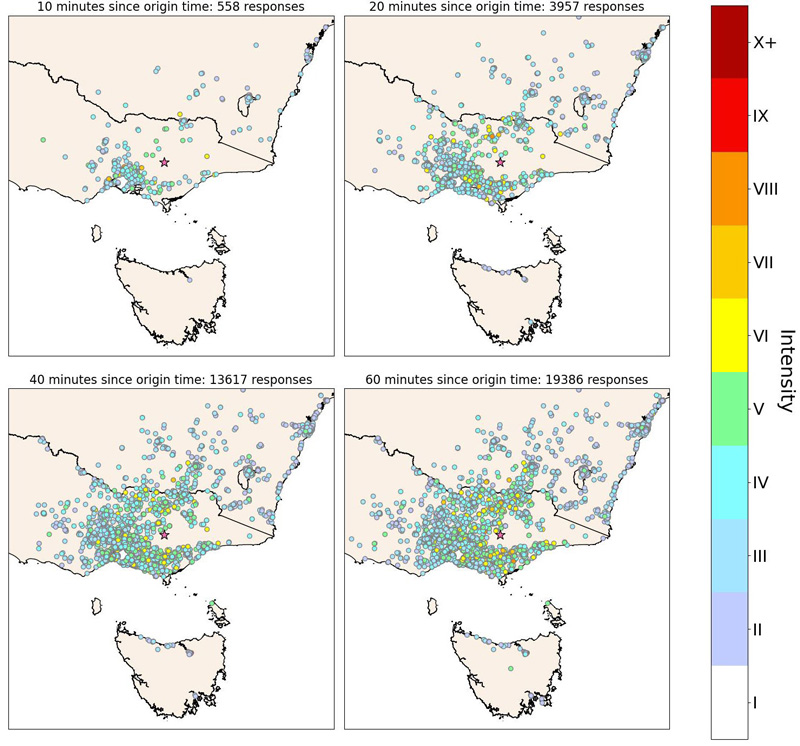
Figure 4: Number and spatial extent of community felt reports for the 22 September 2021 MW 5.9 Woods Point earthquake (epicentre marked by pink star) within 60 minutes of OT.
Public response during the earthquake
The felt reports selected in this study were separated into categories based on the situation of the reporter during the earthquake and the actions they took.
When asked about the situation in the felt report, the questionnaire included options of:
a) Not specified
b) Inside a building
c) Outside a building
d) In a stopped vehicle
e) In a moving vehicle
f) Other.
The responses for ‘Other’ also provided free-text option. If free text was provided, those responses were excluded from the dataset. Having categorised responses by the situation during the earthquake, the actions taken in each situation were assessed.
When asked about actions (responses) in the felt report questionnaire, the questionnaire included options of:
1. Not specified
2. Took no action
3. Moved to doorway
4. Drop, cover and hold on
5. Ran outside
6. Other.
The responses of ‘Other’ were excluded.

Figure 5: Responses of the 32,853 (97.4% of total) who reported being inside a building during the earthquake. Responses include (top left) ‘Took no action’ (48.7%), (top right) ‘Ran outside’ (17.7%), (bottom left) ‘Moved to doorway’ (28.9%) and (bottom right) ‘Drop, cover and hold on’ (3.1%). The background of each subplot shows the same MMI estimate, aggregated over 20 × 20 km cells (shown in Figure 1).
Figure 5 maps the reports where the situation was ‘Inside a building’. The subplots show the locations for responses of options 2 to 5, plotted as black dots overlaying the 20 x 20 FeltGrid (shown in Figure 1). The total number of reports of a given action, and the percentage of the reports for the given situation, are shown for each subplot.
In this study, 97.4% of respondents stated they were inside a building during the earthquake. This is not remarkable given that, at the time, most eastern states were under pandemic lockdown restrictions. Of those who reported being inside a building, 1.7% did not specify a response. Despite the earthquake background reported intensity ranging from IV (blue, light shaking) to VI (yellow, strong shaking), 48.7% responders reported taking no action during the earthquake.
Light shaking on the MMI scale (see Table 1) is described as ‘Felt indoors by many…dishes, windows and doors are disturbed; walls make cracking sounds. Sensation like heavy truck striking the building. Standing vehicles rocked noticeably’. Strong shaking on the MMI scale is described as ‘Felt by all, many frightened. Some heavy furniture moved; a few instances of fallen plaster. Damage slight’.
Given the MMI descriptions of shaking, it is concerning that nearly half of respondents took no action to protect themselves. Of the respondents who did take action, only 3% took the recommended action to ‘drop, cover and hold on’. The remainder either moved to a doorway (28.9%) or ran outside (17.7%). These are not recommended actions. These observations are very similar to those following the 2019 MW 6.6 earthquake offshore from Broome, Western Australia, where 1.3–3.0% of surveyed individuals followed the recommended course of action to ‘Drop, cover and hold on’ (Williams, Whitney and Moseley 2019). As these authors noted by, these figures suggest a gap in earthquake awareness in Australia. Knowledge and understanding of human behaviour during earthquake shaking is limited, and it is observed that even in seismically more active Aotearoa New Zealand, a low proportion of the population takes protective actions when subjected to earthquake ground shaking (Vinnell et al. 2023). In the destructive 2016 MW 7.8 Kaikōura earthquake on the South Island of Aotearoa New Zealand, a quarter of people (a marked difference from approximately 3% in Australia), captured on CCTV in Wellington International Airport, were observed taking some protective action, while the majority responded by standing, walking, looking around, or helping those near them (Vinnell et al. 2022). That said, the ground-shaking intensities experienced in Wellington during the 2016 Kaikōura earthquake were considerably stronger, and of longer duration, than those that would have been experienced by most people during the 2021 Woods Point earthquake. Thus, more people taking protective action during the Kaikōura earthquake is to be expected.
Damage
Of all the submitted felt reports, 3,394 indicated some level of damage (9% of responses). The questionnaire contained 14 different choices to describe damage, but only one option could be selected. Although it is reasonable to consider that multiple types of damage may occur at a location, in this study, we assumed that each respondent’s selection would be the option closest to the worst damage they observed.3 Future research will include investigating the damage type in selected suburbs and comparing that with the available exposure data (e.g. building types and vintage). However, the felt reports from the Geoscience Australia felt report system contain descriptions of damage caused by earthquakes and these data can be shared with emergency managers to support decision-making and research.
Conclusions
The 22 September 2021 MW 5.9 Woods Point earthquake was the largest onshore event to have occurred in Victoria in the modern instrumental era, and probably since European settlement. The NEAC received over 43,000 felt reports with a peak reporting rate of almost 700 reports per minute. The felt reports ranged in severity from personal alarm to building damage that included fallen masonry, cracked walls and chimneys and some buildings shifting over their foundations. Previous studies have shown that felt reports alone can be used to estimate the potential impact on a community of an earthquake in its early stages.
The number and spatial distribution of felt reports received by Geoscience Australia is visible on the EQ@GA website in real-time. FeltGrid and ShakeMap information is available shortly after the earthquake location and magnitude are determined by the NEAC. Respectively, these show the average reported intensity at spatial scales between 1 km and 20 km (updated as more reports are received) and modelled shaking intensity over a broad spatial area (updated periodically). These sources of information can support emergency managers in making decisions for coordinated earthquake response.
The study indicates that people in Australia generally do not know, and/or do not take, the recommended actions during an earthquake. The Drop-Cover-Hold4 routine is the globally recommended course of action during an earthquake. Awareness campaigns and regular exercising, such as the annual Great ShakeOut exercise (Jones and Benthien 2011), could raise awareness about earthquakes to ensure safe outcomes following future earthquakes.