Introduction
The Indian Ocean tsunami in 2004 resulted in 227,000 fatalities across 14 countries. It is a grim reminder that tsunamis are among the world’s most deadly hazards. Most tsunamis are caused by large earthquakes, especially along the Ring of Fire that circles the Pacific Ocean. Tsunamis can be triggered by other atypical phenomena including volcanic eruptions and landslides. While Australia is located some distance from the Ring of Fire, tsunamis can and have reached the Australian coastline. Tsunamis can cross entire oceans and remain destructive when they reach the other side. For example, the 2004 Indian Ocean tsunami, generated by a 9.2 Mw magnitude earthquake near Sumatra in Indonesia, crossed 5,000 km of the Indian Ocean before it reached Somalia in east Africa, causing 300 fatalities (Fritz and Borrero 2006).
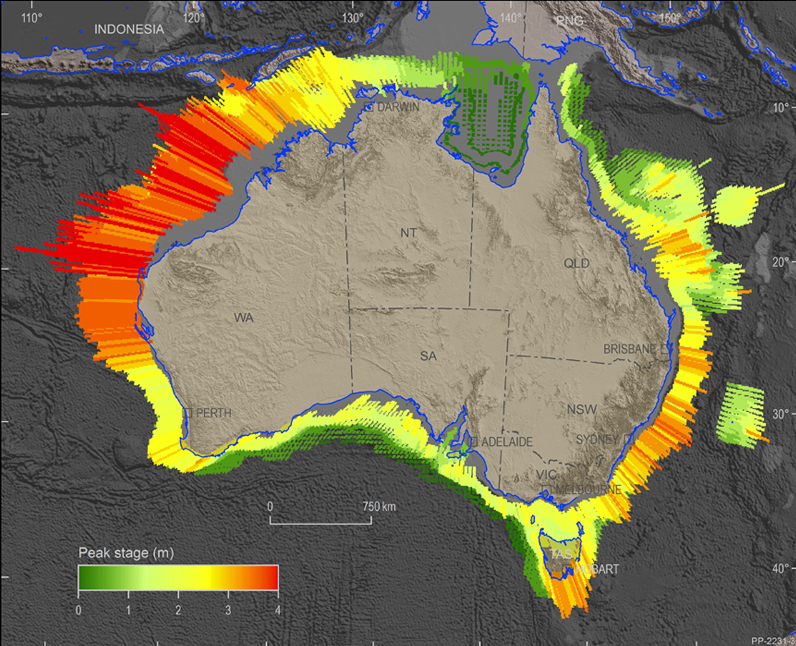
The 2018 Australian Probabilistic Tsunami Hazard Assessment (PTHA18), produced by Geoscience Australia, estimates the chance that tsunamis generated by large-plate boundary earthquakes will occur around the Australian coast (Davies and Griffin 2018). It identifies the coast of Western Australia as having the highest earthquake-generated tsunami hazard in the country (see Figure 1). This is largely due to the state’s relative proximity and exposure to the Sunda Arc subduction zone in Indonesia, which has generated numerous historical tsunamis, including the 2004 Indian Ocean event. Of all natural hazards considered, Western Australia’s Natural Hazards Risk Profile 2017 identified that tsunami posed some of the highest risks to the built environment (SEMC 2017).
An important limitation of the PTHA18 is that it only estimates the tsunami probability in deep water offshore due to plate boundary earthquakes. This is useful to identify broad areas of coastline where earthquake-generated tsunami (historically the most common type) may pose a threat to the community. However, developing tsunami risk reduction strategies requires an understanding of what tsunamis will actually do when they come onshore.
Tsunamis usually feature a long series of waves, not just a single wave. When these waves enter shallow water, they increase in height and travel more slowly. The area inundated depends on complex interactions between the sequence of waves and the elevation of the seafloor and land near the coast. Inundation areas cannot be estimated simply by looking for the onshore contour that corresponds with the maximum offshore wave height. Tsunamis may inundate some areas with elevations multiple times the offshore wave height while leaving other sites with similar elevation untouched.
The Department of Fire and Emergency Services (DFES) in Western Australia is the hazard management agency responsible for managing the adverse effects of a tsunami emergency across the prevention, preparedness, response and recovery spectrum (Government of Western Australia 2006). The department’s roles and responsibilities include tsunami inundation modelling and participation in local and regional tsunami planning (SEMC 2022)
With these responsibilities in mind, DFES has a partnership with Geoscience Australia to understand what earthquake-generated tsunamis will do when they come onshore and to use this knowledge to design risk reduction strategies for specific areas along the coast. The work is a major update to previous modelling of inundation hazards in coastal townships (Stevens et al. 2008). Since 2008, advances in tsunami science and in elevation data coverage for Western Australia have enabled inundation models to be developed with greater accuracy and consistent spatial coverage. Importantly, the new modelling is being used to develop spatially extensive evacuation maps to guide emergency responses to earthquake-generated tsunamis.


Figure 1: The 2018 Australian Probabilistic Tsunami Hazard Assessment of Australia’s coastline.
Source: Davies and Griffin (2018)
Davies and Griffin (2018) estimate the average frequency of tsunamis with different sizes occurring in deep waters offshore of Australia. Only large-plate boundary earthquake sources are considered. This figure shows the 1-in-1,000 year tsunami amplitude (water height above the sea level). Reds and oranges indicate larger waves and greens indicate comparatively smaller waves.
The preliminary evacuation maps outlined in this study are an advance in undertaking preparedness for tsunami. The next steps involve extensive consultation with stakeholders to refine and finalise these maps. In this way, this study is an example of using science to inform operational risk reduction decision-making to increase community safety. The initial phases of the project focused on modelling earthquake-generated tsunami inundation and producing evacuation maps for a study area from Geraldton (430 km north of Perth) to Dunsborough (250 km south of Perth), including the Greater Perth area. Although the tsunami hazard in this zone is not the highest in the state, this area has the largest number of residents living on the coastline and, therefore, has a potentially increased exposure to tsunami.
What might happen when tsunamis come onshore?
The area inundated by an earthquake-generated tsunami depends on several variable factors, including details of the earthquake-induced seabed deformation and several fixed factors, especially elevation in near-coastal areas. While it is not possible to know earthquake properties ahead of time, the probability of different earthquakes can be estimated. For this reason, Geoscience Australia undertook a probabilistic approach to model tsunami inundation. Results include areas from Geraldton to Dunsborough, including the Greater Perth area.
High-resolution elevation data (offshore bathymetry and onshore topographic) are essential for tsunami inundation modelling (AIDR 2018). The Western Australian Government has overseen the collection of high-resolution bathymetric and topographic LiDAR data, which has made detailed inundation modelling possible.
The inundation modelling involved combining PTHA18 with a high-resolution tsunami inundation model:
- PTHA18 was used to define possible earthquake-tsunami scenarios, their rate of occurrence and uncertainties in these rates. All considered scenarios originate on the Sunda Arc, which PTHA18 indicates is the most likely source of distant earthquake-generated tsunamis affecting the study area.
- Several hundred PTHA18 scenarios were selected for inundation modelling, with greater emphasis on scenarios featuring large waves offshore the study area. The scenarios represent a small fraction of those in PTHA18 but are sufficient for inundation hazard calculations (Davies 2022).
- A tsunami inundation model for the region from Geraldton to Dunsborough was developed using high-quality bathymetry and topography data. This model simulates the details of tsunami propagation and inundation. To check its accuracy, 2 historic tsunamis were simulated: the 2004 Mw 9.2 Indian Ocean tsunami and the 2005 Mw 8.6 Sumatra tsunami. These tsunamis were well measured at tide-gauges in the study area and the model showed good agreement with these observations.
- After modelling inundation for the selected PTHA18 scenarios, the results were combined to estimate the average frequency of tsunami inundation due to Sunda Arc earthquakes in the study area (Davies 2022). This frequency of inundation varies from site to site, depending on both the site elevation and the broader tsunami dynamics.
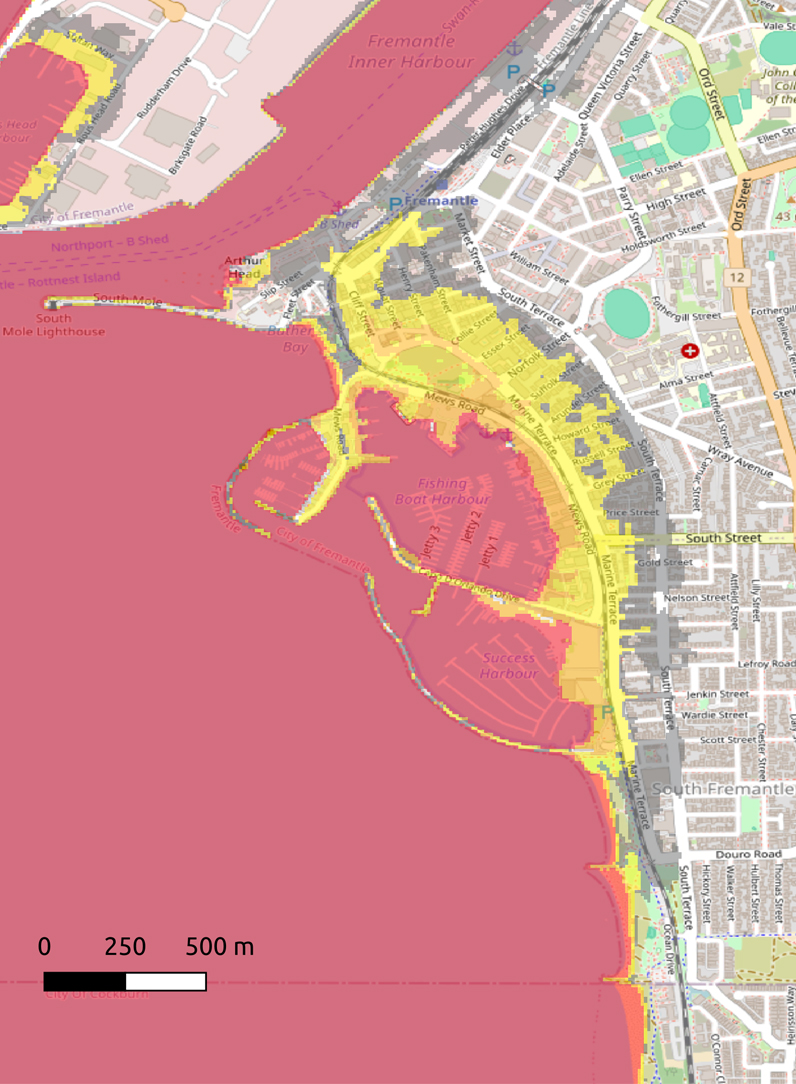
An example output covering a small portion of the modelled area is provided in Figure 2. It shows an estimate of the average long-term inundation frequency (events per year) resulting from tsunamis originating from Sunda Arc earthquakes, assuming a moderately conservative earthquake frequency model (84th percentile uncertainty). Variations on these outputs were developed to account for the uncertain frequency of large earthquakes (Davies 2022).
The methodology includes 2 conservative assumptions:
- All tsunami scenarios are modelled in an otherwise stationary ocean with water level matching the highest astronomical tide in Perth.
- The modelled land roughness is relatively low. It does not account for buildings or dense vegetation that can reduce inundation in some areas.
These assumptions tend to increase the size of the inundation zone. However, a potentially non-conservative limitation of the model is that coastal erosion is not treated. This could potentially change the topography and, thus, inundation patterns during an event. DFES has given qualitative consideration to this issue when using the results to inform evacuation mapping. With this approach, the final evacuation maps are more likely to be an overestimate than an underestimate, which is considered appropriate for public safety application.
Another limitation of the modelling is that atypical tsunami sources are not treated (e.g. submarine landslides, volcanic eruptions, local earthquakes, asteroid impacts). These are rarer events than tsunamis generated by plate boundary earthquakes and are difficult for the current generation of tsunami warning systems to detect and provide advanced warning. However, for atypical tsunamis generated far from the coast, advanced warnings may be possible using sea level observations. The scenarios treated represent the most likely case for which a coordinated evacuation is possible, but further consideration of atypical tsunamis is recommended in the future.


Figure 2: Example of a tsunami inundation map in the Fremantle (Perth) area.
The colours in Figure 2 show the modelled frequency of inundation according to a moderately conservative (84th percentile) model of earthquake frequencies: red (greater than 1-in-100 events per year), orange (1-in-100 to 1-in-500), yellow (1-in-500 to 1-in-2,500), grey (1-in-2,500 to 1-in-10,000).
Improved risk reduction using tsunami inundation scenarios
It is impossible to stop a tsunami once it has been generated so an important aspect of tsunami risk reduction is on pre-planning evacuation. Therefore, additional products were developed to support tsunami warnings.
If a large earthquake occurs, it will be detected within minutes by the Joint Australian Tsunami Warning Centre. They assess whether a tsunami has been generated and, if necessary, will issue tsunami warnings at least 90 minutes before expected arrival. Currently, 2 different warning levels may be issued (Allen and Greenslade 2010; Greenslade et al. 2020):
- Marine warning: The tsunami may cause dangerous waves, fast currents and minor inundation of beaches and shorelines.
- Land warning: The tsunami exceeds the ‘marine warning’ criteria. Some of these events may lead to significant inundation.
In the absence of detailed onshore modelling, the default advice is for people to evacuate 1 km from coastal and estuarine shorelines or at least 10 m above sea level (AIDR 2018).
Recently, it was recommended that the ‘land warning’ category be split into 2 levels (‘minor’ and ‘major’). To date, this has not been operationalised (Greenslade et al. 2020). The warning levels are applied separately to each of the 67 Australian Marine Forecast Zones that collectively cover Australia’s coast.
The Joint Australian Tsunami Warning Centre uses the location and magnitude of the earthquake (estimated minutes after it occurs) to identify similar modelled earthquake-tsunami scenarios in a precomputed scenario database. The modelled offshore wave heights in these selected scenarios are used as the basis for issuing warnings (Greenslade et al. 2020):
- Marine warnings: 95th percentile wave height between 20–55 cm.
- Land warnings: 95th percentile wave height exceeding 55 cm.
The 95th percentile wave height is computed within each of the Australian Marine Forecast Zones so the warning level may differ between zones. The warning level can also be adjusted based on observations of the actual tsunami wave height (e.g. from buoys) as it progresses across the ocean.
For this study, the inundation scenarios were used to map areas that could be inundated during marine or land warnings, which can help emergency services personnel to adapt their response to each kind of warning. To make these maps, each PTHA18 scenario was classified as either a marine warning or land warning for the study area, using the same offshore wave height criteria applied by the Joint Australian Tsunami Warning Centre. Preliminary ‘marine warning’ and ‘land warning’ evacuation zones were then defined by combining the modelled inundation extents of all PTHA18 scenarios classified as ‘marine warning’ or ‘land warning’. The land warning zone was limited to include areas with a probability greater than 1-in-2,500 of occurring each year, while using a conservative ‘84th percentile’ model of earthquake frequencies, following international best-practice (MCDEM 2016; Tonini et al. 2021). The limit represents a compromise between the risks of mass evacuation and the very low likelihood of even larger events, while avoiding an arbitrary choice of ‘worst-case scenario’ that is not well defined for tsunamis (MCDEM 2016).
These model-based zones were edited to produce actionable preliminary evacuation zones. For example, although the inundation modelling enabled the identification of individual house blocks, the boundaries of evacuation zones were adjusted to follow streets or other features that could be easily identified on the ground. The proposed marine evacuation zone was also extended to cover beaches and low-lying areas in the coastline and estuaries.
Tsunami safe locations are places for evacuees to meet and wait for further advice from DFES. These locations were defined using population data (to identify the number of residents who would need to be evacuated from each section of the land warning evacuation zone) and identifying features (such as ovals and parks) in proximity but outside the evacuation zones. These were selected to ensure that they were large enough to accommodate the required number of people and that they were accessible at any time of the day. Evacuation routes were modelled using geospatial least-cost path analysis (i.e. Fraser et al. 2014). This method helped to identify streets and define routes that were the shortest and most direct path between evacuation zones and tsunami safe locations for pedestrian evacuation.
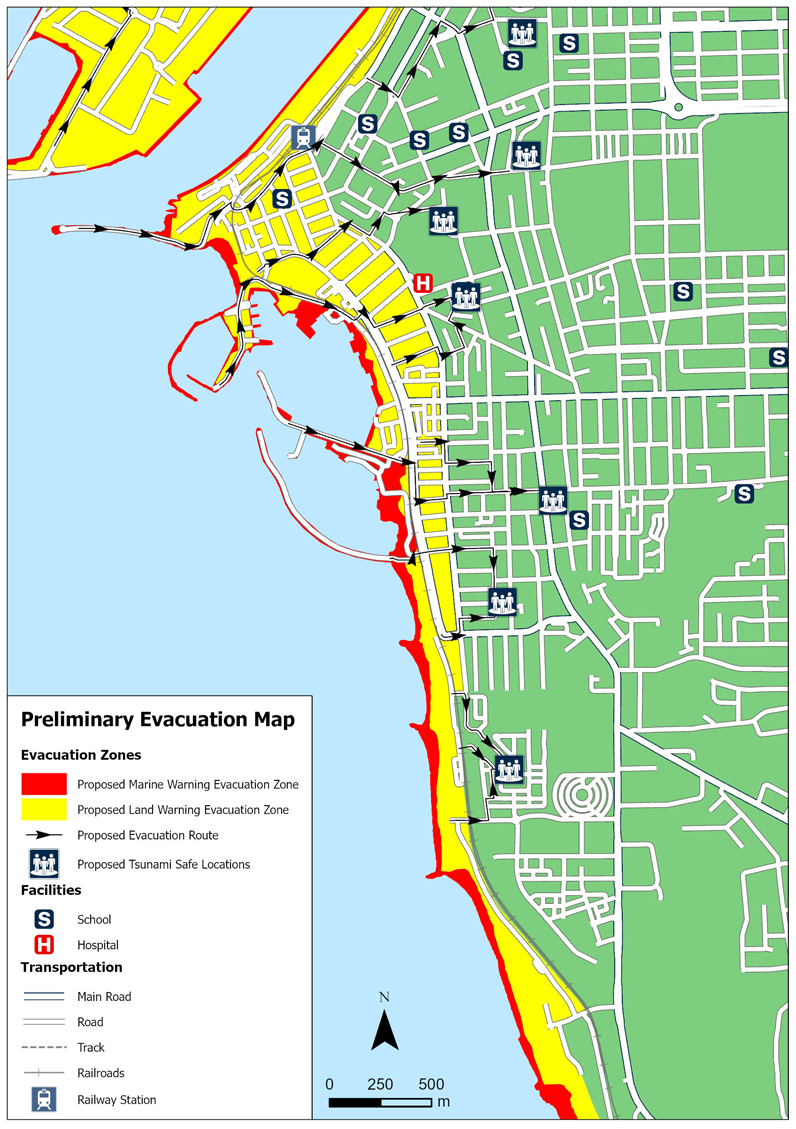
Preliminary evacuation maps were produced showing the location of the evacuation zones for marine and land warnings, tsunami safe locations and evacuation routes (Figure 3). These maps were then reviewed by operational personnel and, where necessary, adjustments made based on their local knowledge.
The response to an impending tsunami is perhaps more time-critical than the response to any other natural hazard. Rather than wasting time working out how to respond once a tsunami warning has been issued, these maps offer a pre-planned ‘recipe’ of how to respond so an increased amount of time can be spent on implementing the response and less on planning the response.


Figure 3: Sample preliminary tsunami evacuation map for Fremantle showing proposed locations of evacuation zones, safe locations and evacuation routes.
The proposed evacuation zones in Figure 3 are informed by inundation modelling for tsunamis generated by plate boundary earthquakes. Adjustments will be made to the strategies identified on these maps based on local knowledge.
Benefits of using inundation scenarios to design evacuation zones
For bushfire and flood, assets (property, infrastructure, landscape) are progressively exposed to the hazard as it moves across the landscape. This enables response resources to be moved between assets as different assets are exposed. In contrast, in a tsunami, all assets are exposed simultaneously. For this reason, identifying which assets to focus on is critical. The greatest advantage of inundation modelling is it improves knowledge of which assets to focus resources on.
In the absence of inundation modelling, the existing land warning advice is to move at least 1 km inland or 10 m above sea level (Allen and Greenslade 2016; AIDR 2018).
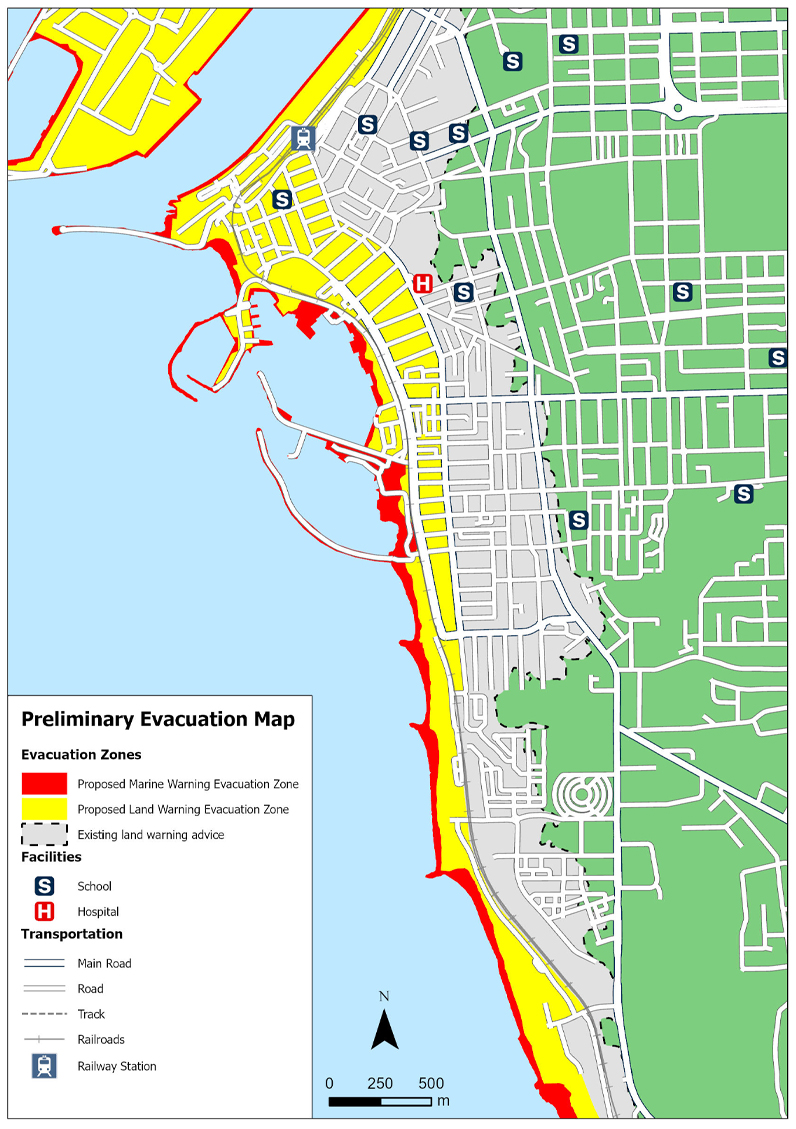
Figure 4 compares this default zone to the preliminary evacuation zones informed by inundation modelling in Fremantle. Table 1 compares the number of features within each zone for the Greater Perth area.

Figure 4: Comparison of default land warning tsunami evacuation zones and those informed by inundation modelling in the Fremantle area.
The inundation modelling enables education, pre-planning and response to be more focused than under the existing default land warning advice. Notably, the inundation modelling identified that a public hospital within the default land warning zone has a low probability of being affected and is no longer within an evacuation zone. Thisis significant because hospitals are difficult and resource intensive to evacuate. It is likely that, in the event of a land warning being issued, a decision would previously have been made to allocate significant resources to evacuate a hospital that likely would not to be affected.
The inundation modelling also enables tsunami education and pre-planning activities to be targeted. For example, the default land warning advice would indicate education and pre-planning activities should be implemented at 22 schools while inundation modelling identified just 3 schools require this.
In the Greater Perth area, the smaller size of the preliminary evacuation zones informed by inundation modelling has enabled safe zones to be located closer to where potential evacuees live than under the existing default land warning advice. This increases the likelihood that, in the event of a land warning, more people will evacuate on foot that will reduce traffic congestion and increase the number of people who are likely to successfully evacuate.
It is notable that inundation modelling suggested minor inundation could occur during ‘marine warning’ earthquake tsunamis. Previous studies identified marine warning scenarios that include some inundation (Greenslade et al. 2020). However, the inundation modelling assumed the highest astronomical tide that may not be the case when a tsunami actually occurs. It cannot be assumed that the marine evacuation zone will be inundated in all marine warning tsunami events. However, the results suggest that careful consideration should be given to the response to larger marine warning events, especially if they coincide with a high astronomical tide.
In the future, there is potential to tailor the evacuation zones by providing more than 2 warning categories (versus the current ‘marine’ and ‘land’ warnings) and tuning the warning thresholds for different coastal regions. For example, if the marine warning category were divided into ‘minor’ and ‘moderate’ or similar, it would be easier to determine whether any evacuations are warranted in the larger marine warning tsunamis. Alternatively, the boundary between ‘marine warning’ and ‘land warning’ could be revised using the model outputs to prevent marine warning inundation. Similarly, if the land warning category were divided into ‘minor land warning’ and ‘major land warning’ and tuned to different coastal regions, as suggested by Greenslade et al. (2020), it is likely that the land warning zones could be reduced for the majority of land warning tsunamis.
Table 1: Comparison of the number of features in default land warning tsunami evacuation zones and those informed by inundation modelling in the Greater Perth area.
| Features | Default existing land warning advice | Preliminary evacuation zones informed from inundation modelling |
| People | >100,000 | <20,000 |
| Schools | 22 | 3 |
| Aged care facilities | 15 | 3 |
| Hospitals | 1 | 0 |
What is next
DFES will use the preliminary evacuation maps and undertake stakeholder engagement to help develop and finalise these maps. The stakeholder engagement will include guidance about how these maps may be used to improve public safety should a tsunami occur. This will assist DFES to meet its responsibilities as the hazard management agency for tsunami.
The current project was undertaken in the comparatively densely populated southwest Western Australia between Geraldton and Dunsborough including the Greater Perth area. Future phases of the project will focus on the north of the state which, while less densely populated, has higher exposure due to its closer proximity to the Sunda Arc. In the future, highly accurate near-coastal elevation data will be captured in this area that will facilitate tsunami inundation modelling.
DFES is planning to use the inundation modelling and evacuation maps to maximise the efficiency of the warning system, develop recommendations to update and amend tsunami plans and procedures, develop awareness products and a communications plan for tsunami awareness. Consideration will be given to the treatment of atypical tsunami sources, which are not modelled in this study. The aim is to reduce the time taken in planning the response when a warning is received and increasing the time to implement the response.
DFES plans to undertake education and pre-planning activities with the owners and users of those high-value community assets, such as schools, that were identified as being within the inundation modelling-informed tsunami evacuation zones.
This project highlighted the benefits of modifying the Joint Australian Tsunami Warning Centre warning thresholds based on modelling. This could make it easier to identify assets exposed to inundation and to target evacuations. Experiences from the Tonga volcanic tsunami in 2021, which nearly reached the land warning threshold in New South Wales and Queensland but did not produce substantial inundation, highlight the need for meaningful warning categories that focus evacuation efforts on sites most likely to be inundated.


