Investigation rural community communication for flood and bushfire preparedness
Dr Helen Boon, James Cook University
Peer-reviewed Article
Abstract
Article
Introduction
The most recent Intergovernmental Panel on Climate Change (IPCC) (2013) report predicted that Australia will sustain more frequent and/or severe wildfires, droughts, cyclones and floods. Such predictions tip many rural communities into vulnerability even before social community characteristics are considered. It therefore becomes imperative for emergency managers to know how to deliver risk communications so communities can prepare for approaching natural hazards. Research has shown that disaster preparedness is positively associated with risk perceptions (Miceli, Sotgiu & Settanni 2008) which in turn are dependent on trusted risk communications (Reininger et al. 2013). The importance of risk communications and their mediating factors on preparedness has been highlighted since Mileti and Fitzpatrick (1992) conducted a large scale study to examine the effectiveness of risk information for earthquake preparedness in the US. They found that risk information was most effective when it was reinforced with additional communication and/or social cues which then led to an active personal search for more information, and a constructed personal meaning of risk and what to do. These social constructions then directed personal preparedness actions.
Communication is woven into the disaster management cycle. This occurs at various stages in the cycle but the United Nations Economic and Social Commission for Asia and the Pacific (UNESCAP) & International Strategy for Disaster Reduction (UNISDR) (2012) emphasis on disaster reduction and preparedness means that effective engagement at the pre-disaster stage is most critical in reducing negative disaster impacts. In his White Paper on Risk Governance, Renn (2005) emphasised the importance of adjusting risk communications to the specific needs of the people. In this way, people are better able to evaluate risks and make informed decisions about preparedness and personal safety measures. Martens et al. (2009) also argued for more attention to the heterogeneity of the public. Simply providing the same message to all individuals at risk is not enough because they may perceive this information differently and respond in different ways (Handmer 2002).
Handmer (2002) emphasised that risk communication must be meaningful, and perceived to be relevant to the recipients. Community diversity based on, for example, experiences, ethnicity, length of residence in the community, socio-economic status, or disability leads to different priorities, languages and levels of understanding, making shared meaning difficult to achieve (Handmer 2002). People are subject to complex socio-psychological processes which partly explain why and how they respond to warnings; they rarely respond in a straightforward ‘stimulus–response’ manner (Parker, Priest & Tapsell 2009). As Paton (2008) argued, preparedness occurs as a result of social cognitive processes (Paton 2000, 2003). People actively evaluate information about hazards, the actions required of them to mitigate the hazard’s effects, and the sources that provide the information before taking appropriate steps to prepare.
Warnings are interpreted and evaluated in both a social context and the context of experience and they may not generate the expected response. Prior experience with, for example, flooding might lead to hypersensitivity to rain and immediate responses (Handmer 2002) or a need to confirm a warning with neighbours because of past ‘false warnings’ and a loss of trust in the organisations issuing the warnings (Parker et al. 2009).
López-Marrero (2010) analysed preparedness measures in two flood-prone communities in Puerto Rico concluding that beliefs that floods were getting less common along with a reliance on structural state interventions for flood protection, reduced householder perceived risks associated with future floods and diminished the willingness to take precautionary measures. Gissing, Keys and Opper (2010, p. 41-42) examined flood preparedness in Australia and cited previous research that found
‘weaknesses in Australian flood warning practices are cultural rather than technical, with flood warning products under-used by a combination of poor attention given to flood warning practice and a response-biased (as distinct from preparedness-focused) culture in which proactive flood emergency management is not valued.’
Nicolopoulos and Hansen (2009) found considerable differences across Australia in levels of disaster preparedness for a range of disasters, and between metropolitan and other areas. They also cited research highlighting how the experience of a disaster, and perceptions of how controllable the disaster is, can affect people’s preparedness. They argue for tailored preparedness programs to targeted communities based on community characteristics. More recently Burnside-Lawry, Akama and Rogers (2013) argue for better understanding of how different communities are composed—especially the content and form of ‘communication capacity’ in different locations. And, after an extensive review of the communication literature about flood risks, Kellens et al. (2013) recommended that more research should be conducted on people’s preferred information channels for risk information. This is important if emergency communication is to reach all community members, including those most vulnerable, the elderly, the socially disadvantaged, those with disabilities, or groups that might have difficulties with the dominant language. Identifying the best, most suitable channel for emergency information for an intended audience is critical for emergency management planning, particularly in an age of evolving communication technologies. Mobile phone and internet use are growing in popularity and authority during emergency situations. Previously underestimated, they now have prominence in the communication media of modern societies (Murthy 2013) and potential importance in relation to disaster emergency communication (Goudie 2013).
In terms of communicating risk to vulnerable communities emergency managers need to know which emergency information is going to be accessed and acted on. Rural communities, defined as having population densities below 150 inhabitants/km2 (OECD 1994) are geographically, demographically and culturally different (Donehower, Hogg & Schell 2011). These differences are important during emergency situations when local governments and other agencies work with emergency management planners to help communities meet their own needs for information by connecting with them in a process that allows a two-way interaction (Handmer 2002, Nicholls 2010). Often there is resistance to emergency warnings; ‘a wait and see’ attitude is not conducive to risk preparation. This makes persuasive and trustworthy communication an imperative to help initiate action and also, just as importantly, to help with the sorts of actions necessary for householder safety needs (Nicholls 2010). For example, a TV or radio announcement about an impending natural hazard with a free call number so that specific questions can be posed is more likely to result in preparedness actions because householders can address particular concerns to their personal circumstances. This, in turn, can provide authorities with a better idea of particular needs and concerns of groups and can lead to more targeted information provision, or response, which could be important for particular vulnerable groups such as the elderly or disabled.
Research focus
The research described here examined emergency communications in two Australian rural communities impacted by flood and fire emergencies respectively. The aim was to find out what communications residents accessed and the links with preparedness and demographic characteristics. Little prior research appears to have been done in the context of small Australian disaster-impacted communities to examine these issues. The selected communities of Beechworth, Victoria (population 4218 and population density of 22 inhabitants/km2) and Ingham, Queensland (population 4768 and population density of 115 inhabitants/km2) experienced bushfires and floods respectively in February 2009. These sites were selected because they could provide valuable empirical data about their actual preparedness and experiences rather than their intentions in a future hazard scenario.
The study was part of a project that examined community resilience to disaster using Bronfenbrenner’s bioecological systems theory as a guiding framework (Boon et al. 2012). The research gathered empirical data about sources of risk communication used by community members and the links to subsequent preparedness factors, not merely intentions to prepare. To obtain accurate contextual data from each community, a mixed methods approach was employed, based on the precept ‘the question dictates the method’ (Cresswell 2003). Interview data was used to inform in situ the body of risk information literature, followed by a survey to generalise findings.
Methods
Focus group interviews were conducted with key stakeholders selected because of their involvement with the disaster and with community groups to gather information about individual experiences. Key stakeholders and focus group members for Ingham were Queensland Health, the local Chamber of Commerce, local community support organisations, cane farmers, social workers, Queensland Police, Hinchinbrook Shire Council, Emergency Management Queensland, local government, local aged care facility, local medical centre, and the business community. For Beechworth the key stakeholders and focus group members were the Beechworth Neighbourhood Centre, Beechworth Chamber of Commerce, Bushfire Youth Development Officer, Emergency Management Planning Committee, Community Strengthening Project, Community Planning, Municipal Recovery Manager, Bruarong Hall Committee member, Community Care officer, orchardists, Beechworth Country Fire Authority (CFA), Beechworth Health Service’s Planned Activity Group, and local farmers.
In late 2010, 40 Beechworth residents and 79 Ingham residents volunteered to participate in focus interviews using semi-structured interview schedules. Interviews lasted 45-60 minutes and were recorded and transcribed. Key informant notes and focus group transcripts were analysed using qualitative techniques as described by Patton (2002). The content analysis process involved identifying, coding and categorising the primary patterns in the data as they appeared. Responses from key informants and focus groups were analysed in the same way, with key issues and themes coded and compiled. Transcript analyses involved interpretations by two researchers, ensuring investigator triangulation was imposed on the interpretation process within each of the research sites, then across both research sites, to derive common elements. These were used to construct the survey questions. The surveys were piloted and validated using a geographically distinct sample of people who had experienced Cyclone Yasi. Final surveys were distributed in each study community from October 2011 to February 2012. Randomised cluster sampling was used to select participating households (Burns 2000). Research assistants approached households identified on map grid points, hand-delivered surveys to occupants, and collected them by arrangement. Surveys were completed only by householders who confirmed they had been through the disaster. The survey response rate was 92 per cent.
The survey comprised eight questions about emergency communications prefaced by the stem: ‘I got critical information at regular intervals during the event from’:
- neighbours or people in my local community
- friends or family
- my local council
- the Country Fire Authority (CFA)/SES
- state government agencies
- my mobile phone
- internet websites
- the radio and television
Additionally the item ‘I received the first warning in time to prepare for the event’ was included.
A further seven items assessed resident retrospective preparedness. They were:
- I prepared/secured my home/property well.
- I was prepared to deal with the physical impact of the event.
- I was aware of evacuation routes and centres for my area.
- I had a fire action plan/household emergency plan to follow.
- I had an emergency kit to use in the event.
- I felt I knew enough about how to best prepare myself and my property for the floods/fires.
- I was prepared to deal with the emotional impact of the event.
Responses were collected on a Likert scale coded 1 (Definitely Disagree) to 4 (Definitely Agree). Analyses were conducted on IBM SPSS 20 software.
Results
Table 1 shows some demographic characteristics of the two communities. Analyses of variance (ANOVA) conducted across the whole sample examining sources of communication and preparedness indicators showed significant differences between the two communities (Figures 1 and 2, Table 2). The only similarities were that in both communities ‘TV and Radio’ were the most highly accessed source of emergency communication and similar proportions of householders had fire or flood emergency plans.
Table 1: Sample characteristics by community.
|
Gender |
Current Age |
Length of residence in community (Years) |
Employed during the event |
||||||||||
|---|---|---|---|---|---|---|---|---|---|---|---|---|---|
|
Male |
Female |
18–25 (%) |
26-40 (%) |
41-55 (%) |
55+ |
2-5 |
5.5-10 (%) |
11-20 (%) |
21-44 (%) |
45 + (%) |
No |
Yes |
|
|
Ingham |
34.6 |
65.4 |
8.9 |
15.6 |
41.1 |
34.4 |
10.2 |
9.8 |
14.9 |
34.5 |
30.5 |
17.4 |
82.6 |
|
Beechworth (N=249) |
35.0 |
65.0 |
2.5 |
16.3 |
25.5 |
55.6 |
15.4 |
20.3 |
21.2 |
28.2 |
14.9 |
22.8 |
77.2 |
Figure 1: Means of preparedness indicators (lower means indicate less preparedness).
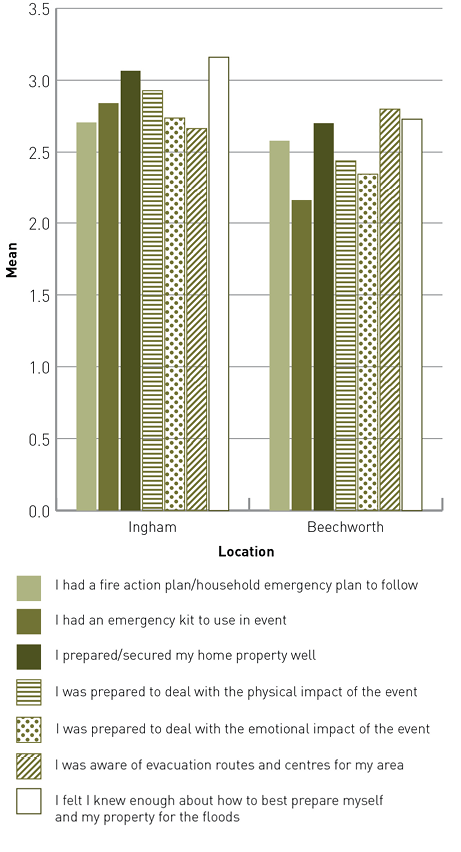
Figure 2: Means of communication timing and sources by community (lower means indicate lower use of the communication type).
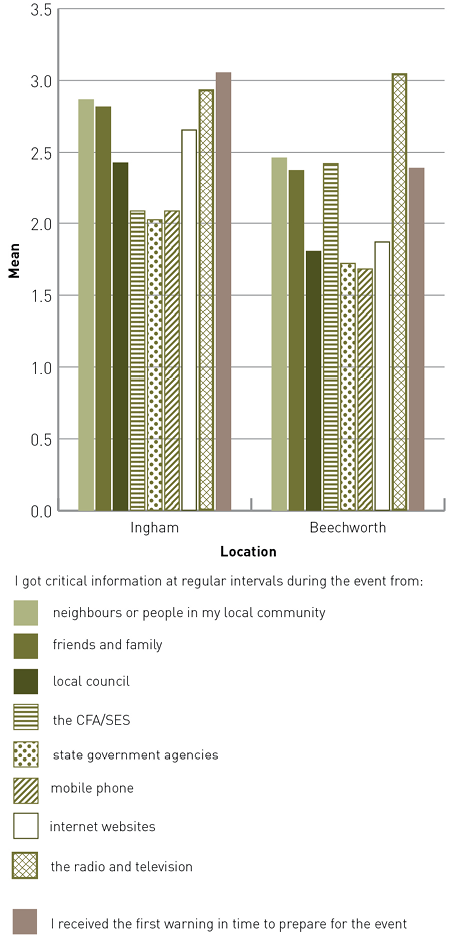
Table 2: Preparedness and communications ANOVA results across communities (N=536).
|
Indicator |
F- ratio |
|---|---|
|
I was prepared to deal with the physical impact of the event. |
29.60** |
|
I was aware of evacuation routes and centres for my area. |
3.92* |
|
I prepared/secured my home/property well. |
15.50** |
|
I had a fire action plan/household emergency plan to follow. |
NS |
|
I had an emergency kit to use in event. |
49.25** |
|
I felt I knew enough about how to best prepare myself and my property for the floods/fires. |
27.86** |
|
I was prepared to deal with the emotional impact of the event. |
21.75** |
|
I received the first warning in time to prepare for the event. |
50.73** |
|
I got critical information at regular intervals from: |
|
|
Neighbours or people in my local community |
12.97** |
|
Friends or family |
18.52** |
|
My local council |
41.62** |
|
The CFA/SES |
8.63** |
|
State government agencies |
8.22** |
|
Mobile phone |
18.73** |
|
Internet websites |
50.76** |
|
The radio and television |
NS |
*Significant at p < .05 level; ** Significant at p < .001 level.
A correlation analysis to examine which modes of emergency communications were linked to preparedness (Tables 3 and 4) showed while both groups endorsed ‘Radio and TV’ most, it did not predict preparedness (r= 0 - 0.2). In Ingham, preparedness was predicted by communications received via:
- the internet, suggesting a proactive approach to risk assessment and access to internet-based communications, a factor associated with higher socioeconomic status, and
- neighbours, friends, family/community members.
Table 3: Correlation coefficients (Pearson's r) between preparedness indicators and communications across the Ingham community (N= 287).
|
Indicator |
1 |
2 |
3 |
4 |
5 |
6 |
7 |
8 |
9 |
10 |
11 |
12 |
13 |
14 |
15 |
16 |
|---|---|---|---|---|---|---|---|---|---|---|---|---|---|---|---|---|
|
I had a fire action plan/household emergency plan to follow |
1 |
|||||||||||||||
|
I had an emergency kit to use in event |
.66** |
1 |
||||||||||||||
|
I prepared/ secured my home/property well |
.63** |
.62** |
1 |
|||||||||||||
|
I was prepared to deal with the physical impact of the event |
.52** |
.48** |
.71** |
1 |
||||||||||||
|
I was prepared to deal with the emotional impact of the event |
.40** |
.38** |
.52** |
.73** |
1 |
|||||||||||
|
I was aware of evacuation routes and centres for my area |
.42** |
.41** |
.43** |
.44** |
.40** |
1 |
||||||||||
|
I received the first warning in time to prepare for the event |
.36** |
.44** |
.54** |
.63** |
.51** |
.50** |
1 |
|||||||||
|
I felt I knew enough about how to best prepare myself and my property for the floods |
.38** |
.43** |
.56** |
.61** |
.60** |
.47** |
.64** |
1 |
||||||||
|
neighbours or people in my local community |
.30** |
.24** |
.37** |
.35** |
.28** |
.26** |
.37** |
.39** |
1 |
|||||||
|
friends or family |
.35** |
.37** |
.37** |
.39** |
.31** |
.33** |
.36** |
.39** |
.65** |
1 |
||||||
|
my local council |
.22** |
.21** |
.24** |
.25** |
.24** |
.34** |
.33** |
.30** |
.36** |
.35** |
1 |
|||||
|
the CFA/SES |
.21** |
.24** |
.28** |
.16* |
.10 |
.20** |
.24** |
.20** |
.20** |
.22** |
.46** |
1 |
||||
|
state government agencies |
.21** |
.21** |
.18** |
.21** |
.13* |
.20** |
.21** |
.21** |
.21** |
.26** |
.47** |
.63** |
1 |
|||
|
mobile phone |
.22** |
.14* |
.23** |
.16* |
.10 |
.17** |
.09 |
.09 |
.20** |
.20** |
.18** |
.41** |
.36** |
1 |
||
|
internet web sites |
.41** |
.31** |
.38** |
.40** |
.30** |
.29** |
.27** |
.32** |
.29** |
.28** |
.13* |
.18** |
.21** |
.38** |
1 |
|
|
the radio and television |
.19** |
.16** |
.19** |
.22** |
.27** |
.26** |
.21** |
.32** |
.29** |
.33** |
.27** |
.12 |
.22** |
.20** |
.34** |
1 |
*Correlation is significant at the 0.05 level (2-tailed), **Correlation is significant at the 0.01 level (2-tailed).
Table 4: Correlation coefficients (Pearson's r) between preparedness indicators and communications in the Beechworth community (N= 249).
|
Indicator |
1 |
2 |
3 |
4 |
5 |
6 |
7 |
8 |
9 |
10 |
11 |
12 |
13 |
14 |
15 |
16 |
|---|---|---|---|---|---|---|---|---|---|---|---|---|---|---|---|---|
|
I had a fire action plan/household emergency plan to follow |
1 |
|||||||||||||||
|
I had an emergency kit to use in event |
.56** |
1 |
||||||||||||||
|
I prepared/ secured my home/property well |
.53** |
.41** |
1 |
|||||||||||||
|
I was prepared to deal with the physical impact of the event |
.40** |
.45** |
.61** |
1 |
||||||||||||
|
I was prepared to deal with the emotional impact of the event |
.30** |
.33** |
.39** |
.65** |
1 |
|||||||||||
|
I was aware of evacuation routes and centres for my area |
.41** |
.34** |
.39** |
.39** |
.35** |
1 |
||||||||||
|
I received the first warning in time to prepare for the event |
.24** |
.25** |
.24** |
.34** |
.31** |
.34** |
1 |
|||||||||
|
I felt I knew enough about how to best prepare myself and my property for the fires |
.49** |
.41** |
.58** |
.50** |
.36** |
.48** |
.38** |
1 |
||||||||
|
neighbours or people in my local community |
.19** |
.13 |
.33** |
.30** |
.20** |
.32** |
.37** |
.39** |
1 |
|||||||
|
friends or family |
.17* |
.09 |
.22** |
.25** |
.12 |
.29** |
.22** |
.32** |
.71** |
1 |
||||||
|
my local council |
.23** |
.20** |
.26** |
.29** |
.21** |
.22** |
.27** |
.22** |
.58** |
.55** |
1 |
|||||
|
the CFA/SES |
.18** |
.14* |
.30** |
.35** |
.23** |
.34** |
.44** |
.39** |
.67** |
.52** |
.66** |
1 |
||||
|
state government agencies |
.10 |
.17* |
.26** |
.28** |
.21** |
.16* |
.31** |
.21** |
.47** |
.42** |
.61** |
.54** |
1 |
|||
|
mobile phone |
.04 |
.03 |
.09 |
.16* |
.16* |
-.01 |
.10 |
.044 |
.25** |
.25** |
.32** |
.36** |
.43** |
1 |
||
|
internet web sites |
.10 |
.19** |
.16* |
.27** |
.11 |
.12 |
.23** |
.14* |
.44** |
.27** |
.52** |
.48** |
.47** |
.47** |
1 |
|
|
the radio and television |
.22** |
.12 |
.16* |
.25** |
.11 |
.22** |
.26** |
.31** |
.27** |
.27** |
.18* |
.31** |
.20** |
.15* |
.29** |
1 |
*Correlation is significant at the 0.05 level (2-tailed), **Correlation is significant at the 0.01 level (2-tailed).
By contrast, Beechworth householder preparedness, which was significantly lower than that of Ingham householders (Table 2), was most strongly linked to communications from CFA/SES (r=0.349 -0.442).
Use of the mobile phone at either site was little represented, perhaps due to poor mobile reception or because too few respondents possessed mobile phones, though the latter was not measured by the survey. Some differences between the two communities might be a result of the high social cohesion of Ingham (Boon 2014) and the difference in disasters (due to the longer lead time for communicating flood risk compared to fire risk as shown in differences between the two sites for the item: ‘I received the first warning in time to prepare for the event’). In addition there is a higher proportion of newcomers in Beechworth compared to Ingham (Table 1). Notwithstanding, some demographic vulnerabilities with regard to access to emergency communications across both sites were detected via ANOVA analyses which compared emergency communication access by age group (four age groups) and employment (N=536) (Table 5).
Table 5: Communications ANOVA results by age group (a) and by employment status (b) across the two communities (N=536).
|
Indicator |
F- ratio /age group |
F- ratio / employment status |
|---|---|---|
|
I got critical information at regular intervals from: |
||
|
Neighbours or people in my local community |
6.29** |
7.91** |
|
Friends or family |
8.28** |
NS |
|
My local council |
NS |
NS |
|
The CFA/SES |
NS |
NS |
|
State government agencies |
3.70* |
4.90* |
|
Mobile phone |
5.73** |
9.90** |
|
Internet web sites |
9.27** |
26.65** |
|
The radio and television |
NS |
NS |
*Significant at p < .05 level; ** Significant at p < .001 level.
Bonferroni multiple comparisons show that significant differences arose because participants aged 55+ relied on communications from ‘Radio and TV’ but had the lowest levels of all other communications (Table 5). In both communities unemployed individuals relied on ‘Radio and TV’ and neighbours for risk communications; they also had markedly lower access to mobile phone or internet sources. This suggests that older people and the unemployed are more vulnerable due to social isolation and need targeted risk communications to successfully prepare for disaster. Communications from neighbours and community members and the internet (for Ingham) and the CFA/SES (for Beechworth), were most predictive of preparedness.
Discussion
This study examined risk communication methods and their links with preparedness. While many factors not measured by this study contribute to preparedness (Mileti & Fitzpatrick 1992, Paton, Smith & Johnston 2005), results show that certain types of communication activities are stronger predictors of preparedness than others. Specifically, while ‘Radio and TV’ were most endorsed as sources of risk communication, information received from neighbours and community members were most predictive of preparedness. Access to websites was also very important for predicting preparedness, possibly because those who were independently seeking information about the flood or fire were relatively proactive, a personal characteristic possibly predictive of preparedness. The mobile phone was unimportant in these sites, perhaps due to unreliable or poor mobile phone coverage, not supporting Goudie’s (2013) contentions that mobile phones are useful channels of emergency communication.
Findings show that risk communication needs to come from trusted sources and highlight the importance of two-way communications, presumably because a dialogue can minimise concerns and anxieties and point to best practice for minimising risk (Handmer 2002, Nicholls 2010, Paton 2008, Peters, Covello & McCallum 1997). The social element found showed that possibly face-to-face, locally relevant information might be crucial for people to personally act on warning messages (Paton 2008) and to find out what to do for their own safety from a trusted messenger. Informal, personal networks clearly reinforced official communications (Handmer 2002). Such influence of social forces on behaviour has been reported before (Ajzen & Fishbein 2005). Subjective norms and culture-driven beliefs that inform views about what is a good or desirable action, are predicted by beliefs about whether others would approve of our behaviour (Ajzen & Fishbein 2005). The potential strength of such social influences is reflected in these findings. Conversely, lack of social sources of information reported by those 55+ years of age and the unemployed was associated with poorer preparedness.
Different communities, like those in this study, need specifically targeted risk communications, tailored to the disaster type and community composition (Handmer 2002, Marten et al. 2009, Nicopoulos & Hansen 2009). The Ingham residents were younger than Beechworth residents which might account for their internet access preferences. Beechworth residents, facing a rapid onset fire event, did not believe they received timely alerts to prepare. The slower onset Ingham flood was better communicated and gave residents a longer period to prepare. The CFA provided effective communications for those who sought information from them, highlighting the importance of access to the internet for more accurate and updated information. However, this option was not available to those who were more socially vulnerable and the elderly. In summary, it seems that for preparedness ‘A trusted source of information is the most important asset that any individual or group can have’ (Longstaff 2005, p. 62).
Conclusion
When emergency warnings are received by householders a series of thought processes arise before action is initiated. The warning must be understood and trusted, it must be considered applicable to the householder’s circumstances to enable deliberation about what sort of action is appropriate, necessary and feasible. The most effective emergency communication seems to be two-way, and locally derived enabling those at risk to get more personalised advice about their household and what action to take to protect themselves and their property. Neighbourhood influences appeared to be important in mobilising preparedness actions. The appointment of neighbourhood flood, fire, or hazard wardens, proposed by Ingham interviewees could prove to be a successful intervention by local government in consultation with emergency managers to help improve preparedness and mitigate disaster, particularly for those who are elderly or unemployed or marginalised in various communities.
References
Ajzen I & Fishbein M 2005, The influence of attitudes on behavior. In: Albarracin D, Johnson BT, Zanna MP (eds) Handbook of attitudes and attitude change: basic principles. Lawrence Erlbaum, New York, pp. 173-221.
Boon, HJ 2014, Disaster resilience in a flood-impacted rural Australian town, Nat Hazards vol.71, pp. 683–701.
Boon HJ, Cottrell A, King D, Stevenson R & Millar J 2012, Bronfenbrenner’s bioecological theory for modelling community resilience to natural disasters. Nat Hazards, vol. 60, pp. 381-408.
Burns RB 2000, Introduction to research, (4th Edition), Frenchs Forest, NSW: Longman.
Burnside-Lawry J, Akama Y & Rogers P 2013, Communication research needs for building societal disaster resilience, Australian Journal of Emergency Management, vol. 28, no. 4, pp. 29-35.
Cresswell JW 2003, Research design: qualitative, quantitative and mixed method approaches (2nd ed.).Thousand Oaks: Sage.
Donehower K, Hogg C & Schell EE 2002, Introduction: Reclaiming the rural. In K. Donehower, C. Hogg, & E.E. Schell (Eds.). Reclaiming the Rural: Essays on Literacy, Rhetoric, and Pedagogy. Essays on Literacy, Rhetoric and Pedagogy. pp. 1-13. Carbondale, IL, USA: Southern Illinois University Press.
Gissing A, Keys C & Opper S 2010, Towards resilience against flood risks. Australian Journal of Emergency Management, vol. 25, no. 2, pp. 39-45.
Handmer J 2002, Are flood warnings futile? Risk communication in emergencies, The Australasian Journal of Disaster and Trauma Studies, vol. 2000, no. 2.
IPCC 2013, Climate Change 2013: The Physical Science Basis. Contribution of Working Group I to the Fifth Assessment Report of the IPCC [Stocker, T.F., et al (eds.)]. Cambridge University Press, Cambridge, United Kingdom and New York, NY, USA.
Goudie D 2013, Engaging disaster prone communities; pre-impact media blitzing. Universal Journal of Communications and Network, vol.1, pp. 95-104.
Kellens W, Terpstra T & De Maeyer P 2013, Perception and Communication of Flood Risks: A Systematic Review of Empirical Research. Risk Analysis, vol. 33, pp. 24-49.
Longstaff PH 2005, Security, resilience, and communication in unpredictable environments such as terrorism, natural disaster, and complex technology. Harvard University Program on Information Resources Policy, Cambridge.
López-Marrero T 2010, An integrative approach to study and promote natural hazards adaptive capacity: a case study of two flood-prone communities in Puerto Rico. The Geographical Journal, vol.176, no. 2, pp. 150-163.
Martens T, Garrelts H, Grunenberg H & Lange H, 2009, Taking the heterogeneity of citizens into account: Flood risk communication in coastal cities – A case study of Bremen. Natural Hazards and Earth System Sciences, Vol. 9, No. 6, pp. 1931–1940.
Miceli R, Sotgiu I & Settanni M 2008, Disaster preparedness and perception of flood risk: A study in an alpine valley in Italy. Journal of Environmental Psychology, vol. 28, no. 2, pp. 164-173.
Mileti DS & Fitzpatrick C 1992, The causal sequence of risk communication in the Parkfield earthquake prediction experiment. Risk Analysis, vol. 12, no. 3, pp. 393-400.
Murthy D 2013, New media and natural disasters, Information, Communication & Society, vol.16, no. 7, pp. 1176-1192.
Nicolopoulos N & Hansen E 2009, How well Prepared are Australian Communities for Natural Disasters and Fire Emergencies? Australian Journal of Emergency Management, vol. 24, no. 1, pp. 60-66.
Nicholls S 2010, The role of communications in supporting resilient communities, In S. Cork (Ed), Resilience and Transformation, preparing Australia for an uncertain future, CSIRO, Collingwood, Vic., pp. 181-187.
Organisation for Economic Co-operation and Development (OECD) 1994, Creating Rural Indicators for Shaping Territorial Policy. Paris: OECD.
Parker DJ, Priest SJ & Tapsell SM 2009, Understanding and enhancing the public’s behavioural response to flood warning information. Meteorological applications, vol. 16, no. 1, pp. 103-114.
Paton D 2000, Emergency Planning: Integrating community development, community resilience and hazard mitigation. Journal of the American Society of Professional Emergency Managers, vol. 7, pp. 109-118.
Paton D 2003, Disaster Preparedness: A social-cognitive perspective. Disaster Prevention and Management, vol. 12, pp. 210-216.
Paton D 2008, Risk communication and natural hazard mitigation: how trust influences its effectiveness. International Journal of Global Environmental Issues, vol. 8, no. 1, pp. 2-16.
Paton D, Smith LM & Johnston D 2005, When good intentions turn bad: promoting natural hazard preparedness. Australian Journal of Emergency Management, vol. 20, pp. 25-30.
Patton MQ 2002, Qualitative research and evaluation methods, Sage, Thousand Oaks.
Peters RG, Covello VT & McCallum DB 1997, The determinants of trust and credibility in environmental risk communication: An empirical study. Risk analysis, vol. 17, no. 1, pp. 43-54.
Reininger BM, Rahbar MH, Lee M, Chen Z, Alam SR, Pope J & Adams B 2013, Social capital and disaster preparedness among low income Mexican Americans in a disaster prone area. Social Science & Medicine, vol. 83, pp. 50-60.
Renn O 2005, White Paper on Risk Governance: Towards an Integrative Approach. Geneva, Switzerland: International Risk Governance Council (IRGC).
UNESCAP & UNISDR 2012, Asia Pacific Disaster Report 2012: Reducing Vulnerability and Exposure to Disasters. At: www.unisdr.org/archive/29286, [February 2014].
About the author
Dr Helen Joanna Boon is a senior lecturer in the areas of educational psychology, special needs and behaviour management. She has a strong research interest in climate change and the intersection of ethics, climate change and adaptation to climate change. Dr Boon has conducted research on community resilience to disasters using mixed methods, including Rasch and Structural Equation analytical methods. She teaches educational psychology and research methodology to undergraduates and post graduate students.