Natural disasters, such as bushfires and floods, frequently impact Australian communities and lead to significant legal challenges for affected individuals. This paper examines the patterns of legal service utilisation by people affected by such events using data from a statewide provider of free disaster-related legal assistance. This research presents findings on 6 primary legal issue categories of insurance, grants, tenancy (loss of dwelling), tenancy (not loss of dwelling), goods and services, and environment/neighbours. The findings suggest that assistance for different types of legal issues is requested at different stages of the recovery process. The analysis highlights the importance of timely and tailored legal assistance to support recovery and resilience. By understanding these patterns, policy makers and service providers can better allocate resources to improve access to necessary support by affected individuals. This research contributes to the understanding of the legal dimensions of disaster recovery and underscores the critical role of legal assistance in response and recovery. Given that many people seek non-legal assistance when resolving legal problems, these results are also relevant for government and community service organisations that provide non-legal support to people experiencing these types of problems post-disaster.
Introduction
Natural disasters such as bushfires and floods are recurrent challenges in Australia and often leave communities devastated and in need of variable forms of support (Commonwealth of Australia 2020). While the immediate aftermath of a disaster typically focuses on physical recovery, an often-overlooked aspect is the significant legal challenges that affected individuals face (Balmer et al. 2023; McDonald 2023; Kothe et al. 2024). These challenges can range from issues with insurance claims and tenancy disputes to navigating government grants and dealing with consumer rights. In Australia, legal assistance services play a critical role in helping disaster-affected individuals navigate these complex issues (Australian Pro Bono Centre 2023), improving access to necessary resources and justice.
The legal needs of people affected by such events are multi-faceted and can have long-lasting consequences if not addressed in a timely and effectively manner (Coumarelos et al. 2012). Research indicates that unmet legal needs can exacerbate the financial and emotional stress people experience, which can lead to adverse outcomes (Currie 2007; Pleasence 2006; Pleasence et al. 2010). For instance, individuals facing insurance disputes may struggle to secure adequate housing or replace lost possessions, while others might encounter barriers to accessing government aid due to bureaucratic complexities (McKenzie et al. 2022).
In response to such issues, legal assistance providers seek to meet this need through disaster-specific legal outreach (Bushfire Legal Help 2010; Hipkin 2021; Star and Sutton 2021). These programs aim to provide timely legal advice and assistance, and help individuals to understand and exercise their rights in the aftermath of a disaster. The effectiveness of these services is crucial as they not only assist in immediate recovery but also contribute to the long-term resilience of communities.
Understanding demand for disaster-specific legal outreach services and the presentation of people with different legal problems over time will assist in service planning and delivery. The effects of these legal issues can be expected to impact demand for non-legal services too. Research by the Victoria Law Foundation showed that many people with legal problems access non-legal help for those problems (Balmer et al. 2023; McDonald 2023) and that many disaster-related legal problems also impact demand for support from other community service providers and government agencies (especially relating to housing, insurance and government benefits). As such, understanding the patterns of presentation for different problems over time has implications for non-legal service providers.
This paper explores the patterns of legal service utilisation by people affected by natural disasters using data from a New South Wales statewide provider of free disaster-related legal assistance. By examining how different types of legal problems present over time following events like bushfires and floods, this study provides insights that can enhance service delivery and policy planning. Understanding these patterns is essential development of targeted support strategies that address the unique legal challenges faced by people impacted by disasters. This ultimately contributes to more robust recovery processes. Given that: (a) different types of problems are likely to present at different times in the post-disaster period and (b) the legal problems people experience is known to be associated with the type of natural disaster (Kothe et al. 2024), trends in service utilisation were examined for the most common legal matters associated with legal assistance after bushfire and flood events.
Methods
Data were obtained from Legal Aid NSW about all legal services provided to individuals from the Disaster Response Legal Service1 between January 2020 and December 2023. Unit record data were provided in a de-identified form and underwent data validation and cleaning prior to analysis (see Kothe et al. 2024 for a detailed description of data cleaning and validation). The Disaster Response Legal Service model and underlying theory of change has been described by Hipkin (2021).
Variables of interest
Matter group and matter type
Services provided by the Disaster Response Legal Service can relate to multiple legal matters. In the data provided for this series of analyses, information about all matter types recorded for each service was extracted.
In this dataset, each legal problem was assigned a ‘matter group’ and a corresponding ‘matter type’. Matter types provided a more detailed description of the specific nature of the problem than the matter group. For example, where a person has a legal problem relating to their consumer rights and protection as a consumer of goods and/or services the matter group ‘goods and services’ would be assigned. Within this, there were more detailed matter types that could be recorded. For example, in the case of the ‘goods and services’ matter group, the matter types provide detail about the type of good or service a person was experiencing a problem with (e.g. ‘energy and water utilities’ or ‘motor vehicle purchase and services’).
Matter groups and matter types are standardised across Legal Aid NSW. As such, some distinct disaster-related legal issues share a single matter type that lacks specificity. For example, the matter type ‘state disaster relief grants’ encapsulates all disaster grants funded by the New South Wales Government including the Disaster Relief Grant and Resilient Homes Program even though the value of these grants and their expected timing in the post-disaster period varies substantially.
Across the services to individuals provided by the Disaster Response Legal Service in response to natural disasters since 2020, 41 different matter groups and 159 different matter types were reported at least once. However, most of these matter groups and types were only infrequently recorded. In this paper, we focus on 6 of the most frequently occurring legal problems: (1) insurance (2) grants (3) tenancy - loss of dwelling (4) tenancy - not loss of dwelling (5) goods and services and (6) environment/neighbours.2 Table 1 provides a description of the matter types that constitute these matter groups.
Table 1: Matter groups analysed in this report and their constituent matter types.
| Matter group | Matter types within matter group |
| Insurance | General insurance (98.5%) Life insurance (1%) Superannuation (<1%) Funeral - future provision (<1%) |
| Goods and services | Energy and water utilities (14.2%) Motor vehicle purchase and services (11.4%) Telecommunication service (8%) Financial services including pawnbrokers/credit report/debt management (3.1%) Education services (2.6%) Other goods and services (61.9%) |
| Grants | State disaster relief grants (97.5%) Commonwealth disaster relief grants (3.5%) |
| Tenancy - loss of dwelling | Other loss of dwelling (not by credit obligation) (59.7%) Private eviction - no grounds (17.5%) Eviction - residential park/boarding house/retirement village (11%) Private eviction - breach (not arrears) (5.2%) Private eviction - rent or water arrears (3%) Eviction - denial of equitable rights/ judicial review (2.4%) Social housing eviction - breach (not arrears) (2.1%) Social housing eviction - no grounds (<1%) Social housing eviction - eligibility (<1%) Social housing eviction - rent or water arrears (<1%) |
| Environment/neighbours | Local government/planning (42.7%) Fences/ trees/animals (40.2%) Neighbour dispute - other (12.1%) Noise/nuisance /pollution (6.3%) Public interest environment (1.8%) |
Time since disaster
The time between the date of the first service for a given disaster event and the date of each service for that event was calculated for the purpose of this analysis. The date of the first service was used as a proxy for the activation of the legal service for each event. This provides an estimate of the time between when a person was impacted by the disaster and when they accessed legal assistance. This estimate is less reliable for the 2019–20 bushfires since all bushfires in that season were recorded as a single disaster event, even though the bushfires occurred over several months. It was not possible to identify the individual bushfire event to which each service related based on data available to the authors. However, the bulk of services were delivered in the immediate aftermath of legal assistance activation for the 2019–20 bushfire season (i.e. in January to February 2020).
Both ‘time in days’ and ‘time in months’ were calculated. To calculate time in months, the number of days since the disaster was divided by 30.44, and the result was rounded down to the nearest whole number. For example, services delivered within the first 30 days were classified as 0 months since the disaster, those delivered between 31 and 61 days as 1 month since the disaster, and so on.
Disaster type
The Disaster Response Legal Service was activated to respond to numerous natural disasters between 1 January 2020 and 31 December 2023. Table 2 shows the number of services associated with each individual event; flood-related events also included damage from storms that occurred in the same period.
Table 2: Number and proportion of services by disaster event.
| Disaster event | Number of services | % of total services |
| March 2022 floods | 4,787 | 55.6 % |
| 2019–20 bushfires | 1,471 | 17.1 % |
| 2021 floods | 932 | 10.8 % |
| October 2022 floods | 918 | 10.7 % |
| July 2022 floods | 409 | 4.8 % |
| 2023 bushfires | 87 | 1.0% |
| Total | 8,604 | 100% |
Analysis plan
Data from bushfires and floods were analysed separately to avoid introducing misleading interpretations of service utilisation over time. The earliest flood event in the dataset occurred in 2021, meaning that only up to three years of post-flood data is available. Combining flood and bushfire data could create the false impression that flood-related problems no longer occur after three years, when the data does not include that period. This distinction is important, as earlier analysis has shown that some types of legal problems are more commonly associated with flooding (Kothe et al., 2024). Analysing each disaster type separately provides a clearer understanding of service use over time, while also accounting for the limits of the available data.
Based on desktop review, it appeared likely that the matter types that comprise the environment/neighbours matter group may exhibit different trends in service utilisation over time. Therefore, for this matter group, data was also analysed at the matter type level, comparing the 2 most common types: ‘fences/trees/animals’ and ‘local government/planning’.
Key descriptive statistics were calculated for service utilisation across each matter group. Specifically, the time taken (in days) to deliver 25%, 50% and 75% of services for each matter group was determined. Data for the 100% quartile was not presented since the legal service continued to provide services for each disaster in this dataset. Additionally, the time taken (in months) to reach both peak and trough service utilisation for each matter group was computed. The calculation of peaks and troughs required the use of monthly data due to variations caused by day-of-the-week effects. However, daily data was used for quantile reporting to provide sufficient granularity.
Density plots were used to visualise the distribution of service utilisation over time across different matter groups. These plots provided a smoothed estimate of the probability density function for the continuous variable of interest; in this case, the time taken for service utilisation. The x-axis of each density plot represents the time taken (in months) for a person to seek a legal service. The y-axis indicates the relative probability of service utilisation occurring at different time intervals. By examining the peaks, spread and tails of the density curves, patterns in service delivery times and areas of high concentration (indicating frequent service delivery times) can be identified and variability across different matter groups can be compared. For instance, a high peak suggests a high concentration of service delivery times around a given month, while the width of the curve reflects the variability in those times. Long tails indicate the presence of outliers or extended service delivery periods. Caution should be taken in interpreting density plots where there are prolonged gaps in service provision. Trends in service utilisation across matter groups was conducted through visual comparison of density plots and through consideration of service utilisation statistics.
Results
Of the 8,604 services delivered by the Disaster Response Legal Service in the data collection period, 7,445 (90%) of services related to the matter groups of interest. Given the potential for a given service to relate to multiple matters, this data accounted for a total of 8,478 legal matters.
Flood
Figure 1 shows service utilisation for flood-related services by matter group. In this figure, the area shaded grey on each plot represents values of months since the disaster that are not possible given the time the first flooding event was recorded (i.e. values beyond 21 months). These values are included on the plots to facilitate visual comparison between this plot and the bushfire density plots by maintaining a consistent scale for the x-axis. There are clear differences in trends in service utilisation over time for flood-related services based on the type of legal problem a person experienced. While all matter groups demonstrated an initial surge in service utilisation shortly after the disaster event, how problems continued to play out over the medium to long-term varied as a function of matter group.
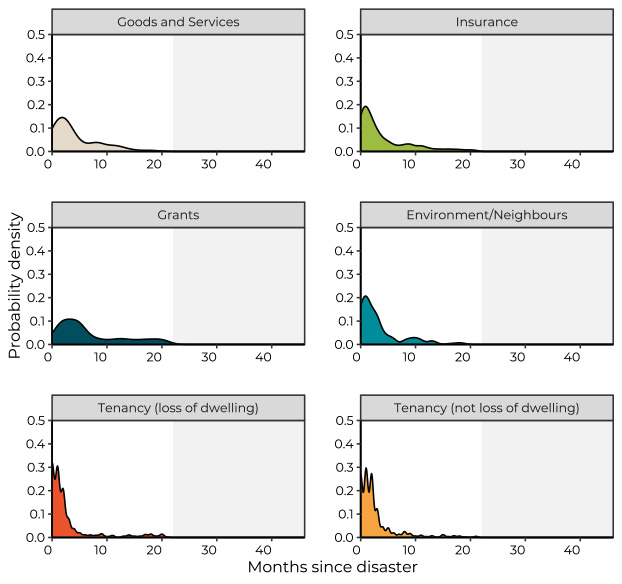
Figure 1: Probability density of post-flood service utilisation by matter group.
Bushfire
Figure 2 shows service utilisation by matter group for bushfire-related services. As with flood-related services, visual inspection shows marked differences in service utilisation trends over time. Only 3 matter groups demonstrated sizeable peaks in service utilisation in the immediate post-disaster period. The probability density for service utilisation for goods and services and environment/neighbours was distributed across the response and recovery period. While the density plot for grant-related matters is included for completeness, given the small number of services related to this matter group following bushfire and issues relating to the recording of this data (discussed in further detail below), we have not included detailed analysis bushfire grant-related matters in this report.
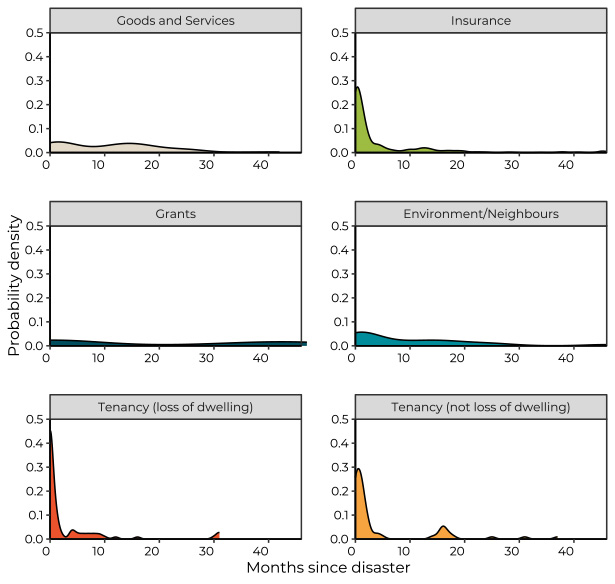
Figure 2: Probability density of post-bushfire service utilisation by matter group.
Goods and services
Overall, 397 services were provided relating to goods and services. Most were classified as ‘other goods and services’ with services relating to utilities, telecommunication providers and purchase and service of motor vehicles also common.
Legal needs survey data shows that people frequently deal with goods and services problems alone or with informal support from family and friends (Balmer et al. 2023). Where people do seek help from others to solve problems of this type they are more likely to use a non-legal source of assistance than to receive independent legal help (Balmer et al. 2023). Common sources for legal help for goods and services related problems include internal complaint and dispute resolution processes, industry specific ombudsmen and dispute resolution services as well as government agencies such as the Department of Fair Trading and the Australian Competition and Consumer Commission (Coumarelos et al. 2012).
Services related to floods
There were 292 services associated with goods and services following a flood. Figure 1 shows a clear peak in goods and services related legal services for flood impacted people. This peak occurs later than for other services and the decline in service utilisation after the peak is relatively slow. This is confirmed by descriptive statistics that show that the peak of service utilisation was at 2 months after the disaster. A quarter (25%) of services had been delivered by 53 days following the disaster, 50% were delivered by 94 days and 75% were delivered by 226 days.
Services related to bushfires
There were 105 services associated with goods and services following a bushfire. Figure 2 does not demonstrate an obvious post-bushfire peak and services related to goods and services spread across much of the post-disaster period. The peak of service utilisation was at one month after the disaster. The first month with no services delivered was 6 months post-event. A quarter (25%) of services had been delivered by 53 days post-disaster, 50% were delivered by 367 days and 75% were delivered by 517 days.
Insurance
Overall, 4,482 services were provided relating to insurance. For both flood and bushfire, the vast majority of these services related to the ‘general insurance’ matter type that includes home insurance, home and contents insurance and vehicle insurance.
People with insurance disputes engage in both internal dispute resolution processes through their insurer and, less commonly, escalate disputes to the Australian Financial Complaints Authority. Both legal services and financial counsellors report providing support to people engaging in dispute resolution processes (Australian Financial Complaints Authority 2023; Legal Aid NSW 2023; Financial Counselling Australia 2023). Given the financial consequences of a denied or delayed insurance claim, it is not surprising that other social services also commonly provide material and psychological support to people experiencing insurance problems. For examples of the contribution of social workers supporting people experiencing issues with insurance, see Alston et al. (2019).
Services related to floods
There were 3,661 insurance services associated with a flood event. Figure 1 shows a notable post-disaster peak in insurance services with continued service utilisation across the entire post-flood period. This is consistent with the descriptive statistics that demonstrate that insurance services peaked at one month post-disaster and there was at least one insurance service in every month represented in the dataset. A quarter (25%) of insurance services had been delivered by 44 days post-disaster, 50% were delivered by 79 days and 75% were delivered by 196 days.
Services related to bushfires
There were 821 insurance and superannuation services associated with a bushfire event. Figure 2 shows a post-disaster peak with a relatively rapid decline in service utilisation. Nevertheless, there is demand for insurance services across the entire post-disaster period. Indeed, descriptive statistics show that insurance services peaked in the first 30 days of a bushfire. The first month with no insurance services delivered was 25 months after the event. A quarter (25%) of services had been delivered by 24 days post-disaster, 50% were delivered by 47 days and 75% were delivered by 139 days.
Grants
Services related to grants accounted for 1,450 legal services provided by the Disaster Response Legal Service. Most services related to NSW Government grants. People who experience problems with grants may also require additional engagement with government departments responsible for grant administration and with social services that provide material and psychological support.
While all problem types demonstrate a long tail with sustained service utilisation beyond the initial disaster response period, this is especially marked for problems relating to government grants and environment/neighbours.
Services related to floods
Grants accounted for 1,411 services provided to flood impacted individuals. Descriptive statistics show that demand for grant-related services peaked at 2 months post-flood. A quarter (25%) of services had been delivered by 84 days, 50% were delivered by 166 days and 75% were delivered by 336 days.
Services related to bushfires
Grants accounted for only 39 services delivered to bushfire-impacted individuals. There were no services delivered relating to this matter group between 3 months and 24 months post-disaster. The small number of recorded services was not surprising given that many grant schemes that account for the flood-related grant services were established in response to major flooding events and were not available for the bulk of bushfire-impacted individuals (National Emergency Management Agency 2024; Kothe et al. 2024). A further issue is that the grant matter group was not available in the Legal Aid NSW data management system immediately following the 2019–20 bushfires. As a result, these matters were provisionally recorded using the matter group ‘Other civil (state) - Civil other – state’. This code is also applied for a range of other civil law problems. While manual re-coding of this provisional coding was conducted once the grant matter group became available, it is possible some services were missed in the process. Because of the low number of total services, the potential for missed cases has disproportionately high impact on the interpretability of these findings. Given this, we have not included analysis of the grant matter group following bushfire in this paper. The analyses of this data over time has a high likelihood of providing misleading information about the trends in services that would be expected following future bushfires.
Environment/neighbours
There were 410 services related to the environment/neighbours matter group delivered by Disaster Response Legal Service. This matter group was dominated by 2 matter types; local government/planning and fences/trees/animals. Since the desktop review had identified that these matters may have different trends in service utilisation over time, the data for this matter group were also explored at the matter type level for these two matter types.
Problems relating to this matter group were likely to result in engagement with a range of non-legal advisers, most notably with local government given the large number of issues relating specifically to local government and planning. Other government agencies with responsibility for planning approval or dispute resolution are also likely to experience increased utilisation following a disaster. For those legal problems that relate to neighbours (e.g. fencing and stock control issues), people may also seek help from NSW Civil and Administrative Tribunal (or other equivalent bodies in other jurisdictions) with or without legal assistance.
Services related to floods
There were 218 flood-related services associated with the environment/neighbours matter group. Figure 1 shows a peak in service utilisation in the immediate post-disaster period followed by steady decline in services delivered. There appears to be a small increase in service utilisation at around 12 months after the flood. The descriptive data shows that the peak in service utilisation occurred one month post-flood. A quarter (25%) of services had been delivered by 36 days, 50% were delivered by 78 days and 75% were delivered by 135 days.
There were 115 services associated with the local government/planning matter type post-flood. A quarter (25%) had been delivered by 27 days, 50% were delivered by 67 days and 75% were delivered by 135 days. Only 42 services relating to fences/animals/trees were delivered post-flood. A quarter had been delivered by 55 days, 50% were delivered by 87 days and 75% were delivered by 132 days.
Services related to bushfires
There were 192 services relating to environment/neighbours delivered following bushfires. Figure 2 shows consistent demand relating to this legal problem type with only a small peak in the initial post-disaster period. The peak in demand is more clearly identified in the descriptive data, which showed a peak in demand in the first 30 days post-bushfire and the first month. The first month with no environment/neighbour related services was 7 months after the event. A quarter (25%) of services were delivered by 31 days, 50% were delivered by 168 days and 75% were delivered by 496 days.
There were 56 services relating to environment/neighbours post-bushfire associated with the local government/planning matter type. It took until 255 days post-disaster for a quarter of these services to be delivered, with 50% delivered by 500 days and 75% delivered by 619 days. In contrast, of the 117 services relating to fences/trees/animals post-bushfire, a quarter (25%) had been delivered by 30 days, 50% were delivered by 49 days and 75% were delivered by 289 days.
Tenancy (loss of dwelling)
Tenancy (loss of dwelling) accounted for 691 services. Most services in this matter group were coded as ‘other loss of dwelling (not by credit obligation)’. Services related to ‘no grounds’ eviction from private tenancies and evictions from caravan parks, boarding houses and retirement villages were also common.
Where people experience a loss of dwelling due to a tenancy-related problem, this will lead to demand for services from housing and homelessness providers, tenant’s advocacy services and dispute resolution processes such as the NSW Civil and Administrative Tribunal (or other equivalent bodies in other jurisdictions) (van den Nouwelant and Cibin 2022; Cortis and Blaxland 2022).
Flood-related tenancy services may be slightly delayed relative to bushfire services. This is likely a reflection of the different impacts these disasters have on housing stock and different dynamics in housing markets in areas that have been disaster-impacted.
Services related to floods
There were 609 services associated with tenancy (loss of dwelling) associated with a flood. Figure 1 shows rapid initial demand that peaks in the first 30 days post-flood and remains at high levels for 2 months after the flood. Service utilisation for this matter group is maintained at lower, but non-zero, levels for most of the data collection period. Descriptive data show that services peaked in the first 30 days post-disaster. The only month with no tenancy (loss of dwelling) services was 12 months after the flood. A quarter (25%) of services had been delivered by 23 days post-disaster, 50% were delivered by 53 days and 75% were delivered by 87 days.
Services related to bushfires
There were 85 services associated with tenancy (loss of dwelling) following a bushfire. Figure 2 shows a large initial peak in the 30 days post-bushfire followed by a rapid decline in service utilisation. Descriptive data show that services peaked in the first 30 days post-disaster. The first month with no tenancy (loss of dwelling) services was 3 months after the bushfires. A quarter (25%) of services had been delivered by 19 days, 50% were delivered by 27 days and 75% were delivered by 69 days.
Tenancy (not loss of dwelling)
Tenancy (not loss of dwelling) accounted for 1,048 services. The most common matter type was ‘repairs and maintenance’, but ‘other tenancy dispute’ and issues relating to caravan parks, boarding houses and retirement villages were also common.
Where people experience a tenancy-related problem that does not directly result in the loss of a dwelling, this will lead to demand for services such as tenant’s advocacy services and dispute resolution processes such as the NSW Civil and Administrative Tribunal (or other equivalent bodies in other jurisdictions). Although this category of legal matter does not directly lead to the loss of a dwelling, where problems cannot be resolved (e.g. where essential maintenance is not performed) there is likely to be downstream demand for services from housing and homelessness providers.
The data related to this matter group and to the tenancy (loss of dwelling) matter group previously described suggests that the long tail may be less marked for tenancy-related issues. This appears to result in less sustained service utilisation. Over 75% of services were delivered within the first 100 days post-disaster. However, it is important to recognise that housing and tenancy services should expect people to still be experiencing problems relating to their housing long after the disaster.
Services related to floods
There were 980 services associated with a tenancy issue that did not lead to the loss of a dwelling following a flood. Figure 1 shows an acute surge in demand during the initial post-disaster period, characterised by a sharp and pronounced peak that declines rapidly but remains above zero throughout the post-flood period. The descriptive data show a peak service utilisation at one month post-flood and there are no months with zero tenancy (not loss of dwelling) services delivered. A quarter (25%) of services had been delivered by 34 days, 50% were delivered by 63 days and 75% were delivered by 100 days.
Services related to bushfires
There were 68 services associated with tenancy (not loss of dwelling) matter group. A quarter (25%) of services had been delivered by 23 days, 50% were delivered by 46 days and 75% were delivered by 76 days. No services were recorded between 6 and 13 months, making the interpretation of the density plot unreliable.
Discussion
The findings from this study highlight the significant and varied legal needs that arise in the aftermath of bushfires and floods in New South Wales. The data underscore that assistance for different types of legal issues is requested at different stages of the recovery process. It is well known that there is an initial surge in demand for services in the immediate post-disaster period (Kothe et al. 2024). While these trends in service utilisation are partly a function of the availability of services and outreach activities, this data suggest that the surge is observed for most issues. Legal service providers and other services that provide help to people impacted by these problems are likely to experience an initial surge in demand following disaster. This surge appears especially rapid for tenancy-related needs while other problems may have a slightly delayed onset.
While all problem types demonstrated a long tail with sustained service utilisation beyond the initial disaster response period, this is especially marked for problems relating to local government and planning and state government grants, which are characterised by low but persistent service utilisation across the post-disaster period. Insurance also showed a very long tail of service utilisation with some people presenting to services for the first time more than 40 months after the event. While the proportion of services relating to insurance long after the disaster is lower than the proportion of long tail planning and grant services, the relatively large number of services related to this matter group means that type of legal problem dominates long tail service delivery.
This time-based variation in service utilisation points to the necessity for a dynamic and responsive legal assistance framework that can adapt to the evolving needs of disaster-impacted populations. Legal service providers must be equipped to handle a diverse range of issues, from immediate post-disaster claims to long-term recovery support. Legal assistance providers and community service organisations that help with these problem types should plan service delivery with expectations about the likely timing and duration of service delivery based on the types of problems that they assist with.
Policy makers and service providers should consider these findings to better plan and allocate resources, so that legal and related non-legal services are accessible and effective throughout the entire recovery phase. In particular, government responses relating to preparedness should be shaped by the expectation that many people will continue to have issues that require assistance from local or state government for years following a disaster.