Investigating the hazard preparatory information-seeking habits of far north Queensland coastal communities
Sandra Astill, Dr Peter Griggs
Peer-reviewed Article
Abstract
Contemporary emergency management advocates the use of hazard preparatory information to educate individuals located in areas exposed to the effects of natural hazards. The provision of this information has been identified as an influencing factor increasing resilience of communities, encouraging careful preparation of property and households, and speeding up the post-event recovery process. To date research has focused on the written message, largely ignoring the hazard preparatory information-seeking habits of those at risk. This study examined the hazard preparatory information-seeking habits of residents in three coastal communities in far north Queensland with differing cyclone and storm surge history. The results showed that resident-owners, with more than five years occupancy, and therefore, more natural hazard experience, were the most likely to seek hazard preparatory information. In addition, some business owners located in areas with no previous cyclone impact experience were unlikely to seek information on preparing their properties and they stated that insurance coverage would mitigate any losses.
Article
Introduction
As climate change experts forecast an increase in the frequency of high magnitude cyclones, low-lying and exposed coastal communities have become the focus of research into the predicted vulnerability of their citizens (Knutson et al. 2010, p. 163, Emanuel 2005, p. 688). Social vulnerability to the impacts of such events have been identified as the most significant factor underlying future vulnerability projections, particularly as coastal migration and urbanisation guarantee future increases in loss of life and property (Pielke et al. 2005, p. 1573, Sarewitz, Pielke & Keykhah 2003, p. 808, Reser, 2007, p. 383). In the past it had been assumed that when people perceived adverse effects from high-risk events, they were more likely to take ameliorative steps to protect themselves, their family and property (O’Connor, Bord & Fisher 1999, p. 461). Related to this assumption has been the role of information and knowledge on the formation of risk perceptions. O’Connor, Bord and Fisher (1999, p. 461) stated that hazard preparatory information such as local government and emergency services brochures and media-based community awareness campaigns, had the potential to influence an individual’s perception of risk, influence environmental behaviour by heightening awareness, as well as assisting in defining problems and identifying appropriate courses of action. Paton (2003, p. 210), however, stated that emergency managers have often assumed that merely making hazard preparatory information available would encourage individuals to prepare for a hazard according to the information provided.
Emergency management, particularly in Australia, places reliance on individuals remaining alert and informed by taking appropriate precautions to protect themselves against risks from natural hazards (Emergency Management Australia 2004, p. 5). This self-help approach to disaster management has placed the ultimate responsibility for knowledge, awareness and preparation directly with the individual, assuming each person understands that disasters fundamentally affect those who are vulnerable, as well as assuming those who require the information recognise their own vulnerability (Lidstone 1994, p. 18, Anderson-Berry & King 2005, p. 390). But what if those who require this information the most do not actively seek it? The aim of this research was to determine if residents and business owners, whose properties were located in areas vulnerable to the effects of cyclones and storm surges, actively sought information on how to better prepare themselves, their families and their properties for the impact of such an event. In addition, the research examined if length of residency, past hazard experience and tenancy also had an influence over the information-seeking habits of these individuals.
Study sites
Prospective study sites located between Cooktown and Townsville in far north Queensland were examined for two criteria. Firstly, the locations had to contain residents and businesses located within 150 metres of the shoreline. Cutter (1996, p. 533) described the proximity to impact as a geographical element of vulnerability. The region of far north Queensland was examined for study sites due to its vulnerability to cyclone events, the most recent being severe tropical Cyclone Larry, a Category 3 cyclone in 2006 and severe tropical Cyclone Yasi, a Category 5 system in 2011. As the 5.4 metre storm surge associated with Cyclone Yasi devastated the townships of Cardwell and Tully Heads in 2011 (Boughton et al. 2011, p. 98), it was clear that surveying participants whose properties were positioned within 150 metres of that shoreline would encapsulate those who could experience the highest level exposure to both cyclone and storm surge impacts in the future. The second criteria took into consideration local government recognition of the risks associated with residing in low-lying areas, particularly in respect to the effects of cyclone-related storm surge. Therefore, each study area also had to lie within the Queensland Government designated Storm Surge Zone and be identified on storm surge mapping found on Queensland local government websites.
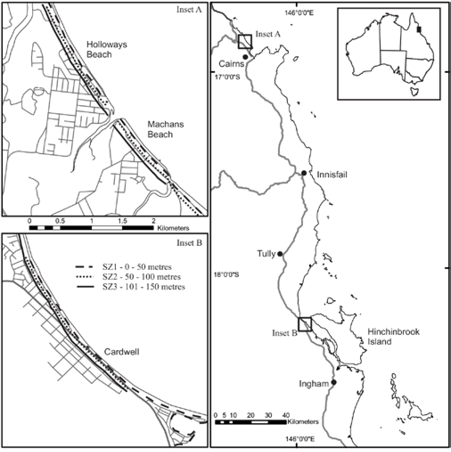
Holloways Beach and Machans Beach, two coastal suburbs north of Cairns, were chosen as the first study area as each fulfilled the two study area criteria, and were examples of communities that had not been directly affected by a cyclone in the previous decade (Figure 1). Combining the data collected from these two adjacent sites enabled the comparison of attitudes to cyclones and storm surges with the township of Cardwell, which was chosen as the second study area (Figure 1). The choice to use Cardwell took into consideration not only its proximity to the foreshore and location within the Strom Surge Zone, but also recent cyclone and storm surge history. These two study sites where chosen as both were similar in respect to their population size, location of residential dwellings and businesses to the water’s edge, vulnerability to the potential effects of cyclone and storm surge, and both locations contained a mix of high and low cost housing. In addition, their differing cyclone history provided an ideal basis upon which to compare the risk perceptions of their inhabitants.
Figure 1: Map showing study sites for research.
Methodology
A questionnaire was designed to establish if there was a relationship between the hazard information-seeking habits of residents and business owners whose properties were located within 150 meters of the shoreline in Cardwell, Machans Beach and Holloways Beach and their perception of risk in relation to cyclones and storm surges. Four pilot studies were conducted to test the questions in both study sites and to ensure the participants in Cardwell were not suffering from survey fatigue after the interest shown in the township following Cyclone Yasi. Following this rigorous testing, it was deemed that the questionnaire required no further changes.
A self-administered, paper-based questionnaire containing 34 questions requiring both qualitative and quantitative responses was delivered to and collected from prospective respondents. Of the 160 surveys delivered, 100 were completed and collected for analysis; 47 from Cardwell and 53 from Holloways Beach and Machans Beach. Participation was voluntary. Questions were developed to ensure the research collected demographic data, past cyclone and storm surge experience, whether a participant sought material on how best to prepare for an event, if they had successfully found information, and whether that material had been useful.
Stratified random sampling methods were employed to select participants for the survey, with maps of each study area used to divide the suburbs into three strata zones identified as SZ1, SZ2 and SZ3. Properties within SZ1 were located between 0-50 metres from the foreshore, while those in SZ2 were 51-100 metres from the foreshore. Residents and businesses in SZ3 were positioned 101-150 metres from the foreshore (Figure 1). Ethics approval to conduct the research was received from the James Cook University Ethics Committee. Data collection was undertaken between 3 September and 12 December 2012. Once data collection was complete, quantitative responses were manually coded and entered into Microsoft Excel. Qualitative data was transferred from each survey, categorised into themes and then transferred into tables for presentation.
Results
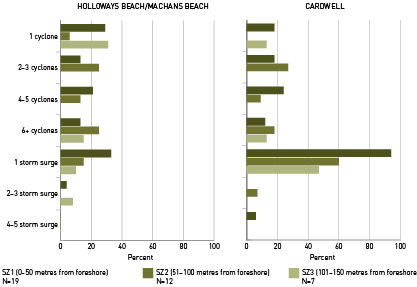
The total sample population of 100 respondents consisted of 40 per cent males and 60 per cent females (Table 1). Most respondents were between the ages of 51-60 years, with more than 50 per cent of respondents classifying themselves as a homeowner. Residential renters were the next most identified group, followed by those respondents classifying themselves as business owners and finally, those who both resided and owned businesses in the study areas. Data also showed that most respondents, regardless of their location, had occupied their property for more than five years, and should, therefore, have experienced more than one cyclone (Figure 2).
Table 1. Demographic profile of study sites.
|
DEMOGRAPHIC FEATURE |
DEMOGRAPHIC DETAIL |
SA1 N=53 |
SA2 N=47 |
|---|---|---|---|
|
Gender |
Male |
38 |
43 |
|
Female |
62 |
57 |
|
|
Age |
18-30 |
8 |
4 |
|
31-40 |
11 |
9 |
|
|
41-50 |
25 |
4 |
|
|
51-60 |
28 |
43 |
|
|
61-70 |
21 |
17 |
|
|
70+ |
8 |
23 |
|
|
Tenancy Status |
Residential Owner |
53 |
57 |
|
Residential Renter |
30 |
21 |
|
|
Business Owner |
8 |
6 |
|
|
Business Owner & Resident |
9 |
15 |
|
|
Location from Foreshore |
SZ1 (0-50 meters from foreshore) |
45 |
36 |
|
SZ2 (51-100 metres from foreshore) |
30 |
32 |
|
|
SZ3 (101 – 150 meters from foreshore) |
25 |
32 |
|
|
Length of Residency |
Less than 1 year (no cyclone experience) |
19 |
6 |
|
Between 1 and 5 years (experienced Cyclone Yasi) |
23 |
32 |
|
|
More than 5 years (experienced with more than one cyclone) |
47 |
49 |
Source: Questionnaire, 2012.
Figure 2: Past cyclone and storm surge experience of respondents.
Source: Questionnaire, 2012.
In order to understand the hazard preparatory information-seeking habits of respondents, participants were asked to describe where they had sourced information, what they felt was the most reliable source of information, and why they had chosen that particular source. The results showed that most respondents, particularly those located within 50 metres of the foreshore, preferred to rely on a combination of information from the media sources, such as television, radio and newspapers, local and state government printed material, such as local council and Emergency Queensland cyclone readiness brochures, and past experience (Table 2).
Table 2. Source of respondents’ hazard information (respondent could choose more than one response).
|
Location |
General Knowledge (%) |
Past Experience (%) |
Friends and Neighbours (%) |
Printed Authority Material * (%) |
Media** |
Weather Forecasters (incl. Bureau of Meteorology Website) (%) |
School (%) |
No Response (%) |
||||||||
|---|---|---|---|---|---|---|---|---|---|---|---|---|---|---|---|---|
|
MB/HB |
C/W |
MB/HB |
C/W |
MB/HB |
C/W |
MB/HB |
C/W |
MB/HB |
C/W |
MB/HB |
C/W |
MB/HB |
C/W |
MB/HB |
C/W |
|
|
SZ1 |
8 |
6 |
21 |
53 |
21 |
24 |
33 |
41 |
58 |
35 |
34 |
24 |
4 |
4 |
6 |
|
|
SZ2 |
6 |
44 |
40 |
19 |
20 |
31 |
7 |
53 |
27 |
12 |
14 |
6 |
6 |
13 |
||
|
SZ3 |
15 |
7 |
31 |
60 |
31 |
13 |
8 |
20 |
38 |
40 |
15 |
33 |
8 |
13 |
||
MB/HB = Machans Beach and Holloways Beach: C/W = Cardwell
SZ1 = 0 - 50 metres from shoreline; SZ2 = 51 - 100 metres from shoreline; SZ3 = 101 – 150 metres from shoreline.
MB/HB SZ1 N = 24, SZ2 N = 16, SZ3 N = 13. C/W SZ1 N =17, SZ2 N = 15, SZ3 N = 15
* Cyclone readiness material produced by local councils, Queensland Government Disaster Management, insurance companies etc.
** television, radio, newspapers and other print media.
Source: Questionnaire, 2012
When respondents were asked for their opinion as to the most reliable sources of information on cyclone preparation, the results indicated respondents from Machans Beach and Holloways Beach preferred weather forecasts and the media (Table 3). Results from Cardwell varied, with respondents within 50 metres of the foreshore stating the most reliable source of information was brochures. Participants between 51-100 metres of the foreshore stated television, while those within 101-150 metres of the foreshore preferred to rely on past experience. It was apparent from these results that respondents with recent cyclone experience whose properties are located within 50 metres of the foreshore, were most likely to seek printed information regarding cyclone preparedness, whereas respondents located further than 50 metres from the foreshore were content to rely on media reports and their past experiences. The most interesting responses were from those who stated they were unable to find any information at all, or that all information was unreliable, inferring that respondents had sought information, but were either unsuccessful or dissatisfied with the quality of the information they found.
Table 3. Respondents’ opinions of the most reliable source of hazard information.
|
Type of Information - Examples of respondents’ comments… |
SZ1 |
SZ2 |
SZ3 |
|||||||||
|---|---|---|---|---|---|---|---|---|---|---|---|---|
|
MB/HB N=24 |
C/W N=17 |
MB/HB N=16 |
C/W N=15 |
MB/HB N=13 |
C/W N=15 |
|||||||
|
Cyclone |
Storm Surge |
Cyclone |
Storm Surge |
Cyclone |
Storm Surge |
Cyclone |
Storm Surge |
Cyclone |
Storm Surge |
Cyclone |
Storm Surge (%) |
|
|
… brochures (unspecified) (MB/HB, SZ1) |
8 |
4 |
18 |
24 |
6 |
19 |
7 |
8 |
8 |
|||
|
… brochures from my insurance companies |
7 |
|||||||||||
|
... I just read (MB/HB, SZ2) |
13 |
6 |
6 |
13 |
7 |
|||||||
|
… info from Emergency Managers like the SES |
6 |
6 |
||||||||||
|
… weather forecasters |
38 |
38 |
18 |
12 |
13 |
13 |
7 |
7 |
1 |
23 |
30 |
13 |
|
… media ( (C/W, SZ3) |
21 |
38 |
36 |
42 |
38 |
37 |
79 |
40 |
55 |
17 |
51 |
28 |
|
… the Internet (MB/HB, SZ2) |
8 |
4 |
18 |
18 |
19 |
13 |
13 |
20 |
15 |
8 |
20 |
13 |
|
… I rely on my own past experience (C/W, SZ2) |
8 |
8 |
18 |
6 |
6 |
13 |
7 |
13 |
8 |
8 |
47 |
29 |
|
… information from people who have lived here all their lives (C/W, SZ2) |
25 |
21 |
6 |
13 |
19 |
7 |
7 |
8 |
8 |
13 |
||
|
… I just get information from everywhere (MB/HB, S23) |
6 |
|||||||||||
|
… I can’t find any (C/W, SZ2) |
4 |
7 |
7 |
7 |
13 |
|||||||
|
… watch the animals |
|
8 |
8 |
|||||||||
|
… I go to the Council website (MB/HB, SZ1) |
13 |
21 |
6 |
13 |
8 |
|||||||
|
… I think all information is unreliable (MB/HB, SZ2) |
13 |
|||||||||||
|
No response |
6 |
6 |
19 |
6 |
13 |
13 |
17 |
15 |
13 |
13 |
||
MB/HB = Machans Beach/Holloways Beach; C/W = Cardwell.
Source: Questionnaire, 2012.
When respondents were asked why they had chosen information from particular sources the most frequent response was that these were the most convenient (Table 4). Results indicated that respondents in this study, regardless of their location, preferred to use information that was easy to access.
Table 4. Respondents’ reasons for choosing particular source of hazard information.
|
Why did you choose those particular sources of information? Examples of respondent comments… |
Machans Beach and |
Cardwell |
||||
|---|---|---|---|---|---|---|
|
SZ 1 N=24 |
SZ 2 |
SZ 3 |
SZ 1 |
SZ 2 |
SZ 3 N=15 |
|
|
… it is the most accurate and reliable (MB/HB, SZ2) |
25 |
32 |
23 |
6 |
20 |
14 |
|
… it is convenient, readily available anytime (MB/HB, SZ1) |
38 |
31 |
23 |
24 |
27 |
20 |
|
… it is easy to understand…I hate the technical stuff (C/W, SZ2) |
6 |
6 |
7 |
|||
|
… it is regularly updated (MB/HB, SZ2) |
8 |
13 |
6 |
|||
|
… it is most informative (C/W, SZ1) |
6 |
|||||
|
… it is generally interesting (C/W, SZ3) |
6 |
7 |
||||
|
… I want information that is easy to file and keep handy (C/W, SZ1) |
6 |
|||||
|
… I like it because it is home delivered and I don’t have to search for it (MB/HB, SZ3) |
4 |
6 |
8 |
6 |
7 |
|
|
… I had nothing else to use (C/W, SZ2) |
7 |
|||||
|
… I like the pictures (MB/HB, SZ2) |
6 |
|||||
|
… It was locally relevant (MB/HB, SZ3) |
8 |
|||||
|
…I needed brochures for the vision impaired but didn’t know where to get them (MB/HB, SZ1) |
4 |
|||||
|
… I trusted the source (MB/HB, SZ3) |
4 |
8 |
||||
|
… I don’t know why I used it, I just did (C/W, SZ3) |
20 |
|||||
|
… Did not respond |
13 |
13 |
31 |
29 |
47 |
27 |
SZ1 = 0 - 50 metres from shoreline; SZ2 = 51 - 100 metres from shoreline; SZ3 = 101 – 150 metres from shoreline.
Source: Questionnaire, 2012.
Respondents were asked if the acquired information had influenced their perception of risk and their preparation for a cyclone. Results were examined to compare the responses from each tenancy status. When questioned as to whether information was an influence on a respondent’s perception of risk, results showed that hazard information had increased the risk perception of most residential owners, regardless of location, as well as residential renters and business owners who were also residents in Holloways Beach and Machans Beach. These outcomes however, differed in Cardwell with most residential renters stating the information had no effect of their perception of risk. Participants who were business owners only, and did not reside in Holloways Beach and Machans Beach, and whose business was located within 100 metres of the water, also indicated the information had increased risk perceptions, but those located further back stated there had been no change. Business owners in Cardwell located within 100 metres of the foreshore declined to answer this question, but those located more than 101 metres from the foreshore indicated an increase in their risk perception. These respondents comprised mainly of motel and caravan park owners who had suffered extensive damage to their businesses, as well as high financial losses, closing their businesses for many months.
Finally, participants in Cardwell who indicated they were both business owners and residents stated that hazard information had increased their perception of risk if their property was located between 51-150 metres from the foreshore, but those located within 50 metres of the water mostly indicated that the information had no influence. Results also showed that most respondents, regardless of tenancy status and location, found the information had influenced their preparation for a cyclone or storm surge. The only exceptions were residential renters within 50 metres of the foreshore in Cardwell and business owners located between 51-100 metres of the foreshore from Machans Beach and Holloways Beach who stated that the information had not better prepared them for the effects of a cyclone.
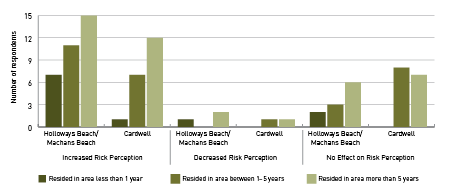
Data was then examined to determine whether a respondent’s length of residency influenced their perception of risk in relation to hazard preparatory information (Figure 3). Results illustrated that when hazard preparatory information had been used by a respondent, their perception of risk in relation to the potential damage a cyclone or storm surge could cause was most likely to increase or remain unchanged, regardless of the length of time they had occupied their property. Most importantly, this data also confirmed that the use of information rarely decreased an individual’s perception of risk.
Figure 3: Comparing length of residency on the influence hazard information had on respondent perception of risk.
Source: Questionnaire, 2012
Discussion
This study found that the majority of respondents, regardless of their geographic location or their proximity from the beach, preferred hazard information to be disseminated via mass media, as this method was easy to access. This result inferred respondents were mostly unprepared to actively seek out information per se. Rather, they preferred information to be transmitted directly into their homes. In addition, the information most sought was up to date weather reports. An important observation was that the questions were answered in a manner which showed that respondents only sought information when a cyclone was imminent. This infers that participants had not undertaken early preparations, preferring instead to seek extra information when a cyclone was likely to impact on the area.
Investigating whether a respondent’s proximity to the foreshore influenced information-seeking habits found that respondents whose properties were located within 50 metres of the shoreline in Cardwell, despite recent past experience, still sought printed information in the form of brochures, to assist with preparation, while those located between 51-150 metres of the shoreline preferred to rely on media reports and past experiences. These findings appear to concur with those made by Anderson-Berry and King (2005, p. 44) who stated that despite previous research suggesting that frequent contact or familiarity with a natural hazard reduced perceived risk, their research had found that the study sample perceived the risk from both cyclone and storm surge as high, despite surviving Cyclone Steve during the sample collection period. This heightened sense of risk appears to influence individuals in the most vulnerable locations to seek out further information to improve their preparation actions. For example, Cairns Regional Council place hazard preparedness information in Council operated facilities such as local libraries, Council chambers and neighbourhood community centres, which may not be an obvious location to look for hazard preparedness information if you are a new resident, for example.
Conversely, the results from respondents in Holloways Beach and Machans Beach located within 50 metres of the shoreline indicated that the majority did not actively seek out preparatory information. Rather, they too preferred hazard information from the media. This result was repeated throughout the entire study area, which, according to Park, Scherer and Glynn (2001, p. 282), raises concerns. They warned that preferring mass media hazard information messages had the potential to influence an individual’s perception of risk within his or her society but may not necessarily affect personal perception of risk, nor might it translate into behavioural changes required to protect the individual. The concern here is that if the preferred method of receipt of information for far north Queensland communities is the mass media, emergency managers might consider designing campaigns that emphasis personal risk while using the media to disseminate information prior to cyclone season. At the very least, consideration could be given to designing campaigns that use the media to redirect individuals to informative websites, libraries or other locations distributing preparatory information.
The influence hazard preparatory information had on the risk perception of respondents was examined from the perspective of past experience, tenancy status and location from shoreline. James, Hawkins and Rowel (2007, p. 1) and Cutter (1996, p. 533) had identified that the proximity to a natural hazard altered an individual’s perception of risk. Data from this study agreed with these findings, as respondents whose properties were located within 50 metres of the foreshore did have a heightened perception of cyclone and storm surge risk compared to those located further back. This research also confirmed Li’s (2009, p. 379) observations that suggested as an individual’s personal experience with a natural hazard increased, so did their perception of risk associated with that natural hazard, resulting in a heightened sense of preparation and sheltering behaviour. The majority of respondents in this study had occupied their properties for more than five years and, as such, had either been directly impacted by a cyclone or had seen the catastrophic consequences of cyclones in the near vicinity. This past experience had resulted in a generally heightened risk perception level among participants, although differences in attitudes were evident between those in differing tenancy levels.
Examining the responses from residential owners and renters, those who were business owners only, as well as those who were both residents and business owners showed that most respondents, regardless of tenancy status, stated that hazard preparatory information had increased their risk perceptions. The only exceptions were business owners in Holloways Beach and Machans Beach located between 101-150 metres from the water, along with some residential renters in Cardwell located within 50 metres of the foreshore. Grothmann and Reusswig (2006, p. 114) stated that differences in attitudes between owners and tenants were to be expected for two reasons. The first was that an owner had far more to loose than a tenant in the face of a natural disaster as the hazard had the potential to cause serious damage to infrastructure. Secondly, tenants are often not permitted to make adjustments to buildings or properties to further protect against damage from a natural hazard. Therefore, the outcomes for residential renters were expected, but the responses from business owners were not (Table 5).
Table 5. Machans Beach and Holloways Beach business owners’ views on hazard preparation.
|
Respondent location |
Respondent response |
|---|---|
|
Machans Beach/Holloways Beach 101–150 metres from foreshore Business Owner |
‘…I don’t worry about reading anything because insurance covers everything... that’s why I have insurance. Most of the information is of no use anyway…it’s not written for businesses.’ |
|
Machans Beach/Holloways Beach 101–150 metres from foreshore Business Owner |
‘…I don’t have time to read anything…I just do the basics and leave. I have insurance so that I don’t have to worry.’ |
|
Machans Beach/Holloways Beach 101–150 metres from foreshore Business Owner |
‘…No-one with a business has time to worry about things like that.’ |
|
Machans Beach/Holloways Beach 101–150 metres from foreshore Business Owner |
‘…I figure if the storm surge reaches me, then it would have destroyed everything here in Holloways Beach anyway….I won’t have anyone coming here to stay, so what does it matter.’ |
Source: Questionnaire, 2012.
The responses from these respondents inferred that insured business owners with no previous hazard experience believed that insurance reduced the risk of financial losses, which translated into a reduced need to prepare for a cyclone or storm surge. This attitude was confined only to Holloways Beach and Machans Beach and only to business owners located over 100 metres from the beach. The remaining participants from Holloways Beach and Machans Beach and no other respondents from Cardwell stated this belief. It is the recommendation of this study that further research be undertaken to determine if business owners without hazard impact experience believe that insurance reduces the risk of financial loss, as well as the need to seek information on how to better prepare for an event in the future. Actions such as these have the potential to cause avoidable damage to not only property but also to surrounding properties.
Conclusion
This study confirmed that it is not simply the provision of hazard information that influences a person’s perception of risk; it is whether that person perceives a need to seek out that information. Emergency managers may need to consider designing campaigns that focus on changing the hazard preparatory information-seeking habits of those who are vulnerable. When information is sought, found and used, it has the potential to increase an individual’s perception of risk, which potentially translates into the intention to better prepare for an event in the future. Most importantly this study confirmed the importance of understanding that each community has unique hazard preparatory information-seeking habits, and that these must be considered if information is to reach those in harm’s way. If emergency managers in Australia continue to rely on individuals being responsible for their own hazard mitigation and knowledge, then the challenge will be to develop ways that capture the attention of those who are most vulnerable, and which encourage vulnerable citizens to seek out and use information designed to improve both the physical preparation of their property and the psychological preparation of themselves and their families. More research should be carried out in this area.
References
Anderson-Berry L & King D 2005, Mitigation of the Impact of Tropical Cyclones in Northern Australia Through Community Capacity Enhancement, Mitigation and Adaption Strategies for Global Change, vol. 10, pp. 367-392.
Boughton GN, Henderson DJ, Ginger JD, Holmes JD, Walker GR, Leitch CJ, Somerville LR, Frye U, Jasasinghe NC & Kim PY 2011, Tropical Cyclone Yasi Structural Damage to Buildings, CTS Technical Report No. 57, James Cook University, Townsville, Australia.
Cutter SL 1996, Vulnerability to environmental hazards, Progress in Human Geography, vol. 20, no. 4, pp. 529-539.
Emanuel K 2005, Increasing destructiveness of tropical cyclones over the past 30 years, Nature, vol. 436, no. 4, pp. 686-688.
Emergency Management Australia 2004, Emergency Management in Australia: Concept and Principles, Emergency Management Australia, Canberra.
Grothmann T & Reusswig F 2006, People at Risk of Flooding: Why Some Residents Take Precautionary Action While Others Do Not, Natural Hazards, vol. 38, pp. 101-120.
James X, Hawkins A & Rowel R 2007, An Assessment of the Cultural Appropriateness of Emergency Preparedness Communication for Low Income Minorities, Journal of Homeland Security and Emergency Management, vol. 4, no. 3, pp. 1-24.
Knutson TR, McBride JL, Chan J, Emanuel K, Holland G, Landsea C, Held I, Kossin JP, Srivastava AK & Sugi M 2010, Topical Cyclones and Climate Change, Nature Geoscience, vol. 3, no. 3, pp. 157-163.
Li GM 2008, Tropical cyclone risk perceptions in Darwin, Australia: a comparison of different residential groups, Natural Hazards, vol. 48, pp. 365-382.
Lidston JG 1994, Learning to Live Safely in the Australian Environment, in JW Handmer (ed), Education for disaster reduction: World Disaster Reduction Day 1993, Resource and Environmental Studies, 9, Centre for Resource and Environmental Studies, Australian National University, Canberra, pp. 15-22. At: http://eprints.qut.edu.au/16840/1/16840.pdf [7 February 2013].
O’Connor RE, Bord RJ & Fisher A 1999, Risk Perceptions, General Environmental Beliefs, and Willingness to Address Climate Change, Risk Analysis, vol. 19, no. 3, pp. 461-471.
Park E, Scherer CW & Glynn CJ 2001, Community involvement and risk perception at personal and societal levels, Health, Risk & Society, vol. 3, no. 3, pp. 282-292.
Paton D 2003, Disaster preparedness: a social cognitive perspective, Disaster Prevention and Management, vol. 12, no. 3, pp. 210-216.
Pielke RA, Landsea C, Mayfield M, Laver J & Pasch R 2005, Hurricanes and Global Warming, American Meteorological Society, vol. 86, pp. 1571-1575.
Reser JP 2007, The Experience of Natural Disasters: Psychological Perspectives and Understandings, in International Perspectives on Natural Disasters: Occurrence, Mitigation and Consequence, J.P. Stoltman, J. Lidston & L.M. DeChano (Eds), Springer, The Netherlands, pp. 369-382.
Sarewitz D, Pielke R & Keykhah M 2003, Vulnerability and Risk: Some Thoughts from a Political and Policy Perspective, Risk Analysis, vol. 23, no. 4, pp. 805-811.
About the authors
Sandra Astill is a PhD candidate at James Cook University. This article outlines some of the findings from research for her Honours thesis. She has commenced PhD studies in the field of natural hazard research.
Dr Peter Griggs is a Senior Lecturer in Human Geography at the Cairns Campus of James Cook University. He teaches introductory human geography, population geography and environmental economics.