Heatwaves in Queensland
Peer-reviewed Article
Submitted: 1 July 2016. Accepted: 2 September 2016.
Abstract
Article
Introduction
The Bureau of Meteorology (Bureau) has experienced a rising demand for heatwave services in Queensland. The Bureau was first approached for a heatwave service following extreme conditions in February 2004 in which 75 known excess deaths1 occurred in southeast Queensland (Tong, Ren & Becker 2010). In January 2014, the Bureau introduced a pilot heatwave forecasting service of national scope using the EHF metric of heatwave intensity. The heatwave forecasting service is an extension of the Bureau’s routine forecasting of daily maximum and minimum temperatures. The service has been used over the two warm seasons from November to March 2014-2016.
Forecasts are issued every day and comprise a set of seven maps of heatwave severity, each one valid for a three-day period. The first two maps cover periods that are partially in the past at the time of issue i.e. {the day before yesterday + yesterday + today} and {yesterday + today + tomorrow}. The last five maps comprise the actual forecasts i.e. {today + tomorrow + the next day}, {tomorrow + the next day + the day after} and so on.
The EHF is derived from two EHIs (Nairn & Fawcett 2013, 2015). The significance EHI characterises whether the three-day period under consideration is hot with respect to the typical annual cycle of temperatures at the location, while the acclimatisation EHI characterises whether the three-day period is warm with respect to the immediate past, specifically the preceding 30 days. EHF has been shown to have superior sensitivity (Scalley et al. 2015) to human heat-health response. The EHIs are calculated from daily temperature (DT), which is the average of the maximum and minimum temperatures in a 9am-to-9am 24-hour period; the maximum temperature typically occurring in the afternoon and the minimum temperature in the following morning. Specifically:
EHIsig = DT3-day – DT95
EHIaccl = DT3-day – DT30-day
DT3-day denotes the average daily temperature across three consecutive days while DT30-day denotes the average daily temperature across the 30 days preceding the nominal three-day period. DT95 denotes the 95th percentile of daily temperature across a long reference period. Lastly:
EHF = EHIsig × max(1,EHIaccl)
The units of EHIsig and EHIaccl are degrees Celsius (°C), alternatively Kelvin (K), while the units of EHF are °C2, alternatively K2.
Positive values of the EHF are associated with the presence of heatwave conditions; negative values with their absence. As a single EHF value is associated with a single three-day period, a positive EHF value is taken to indicate heatwave conditions across all three days. By construction, a positive EHF value only occurs when the significance EHI is also positive, with the implication that the three-day period is hot with respect to the typical annual cycle of temperature at the location. Thus, heatwaves defined in this way predominantly occur in the November to March period in the southern hemisphere. In order to characterise the severity of heatwaves, the 85th percentile (EHF85) is taken of the EHF values associated with heatwave conditions as the threshold for a severe heatwave, and three times that severity threshold as the criterion for an extreme heatwave. Hence EHF greater than EHF85 implies a severe heatwave for the three-day period, while EHF greater than three times the EHF85 implies an extreme heatwave. The EHF85 threshold is likewise calculated over a long reference period. The choice of these reference periods are, in part, influenced by data availability considerations.
This paper presents a heatwave climatology for Queensland using a 54-year reference period 1958-2011. This is used in the construction of the Bureau’s gridded historical EHF dataset and associated heatwave service. This is contrasted against the period 1986-2015 revealing increased rates of heatwave occurrence. Some significant Queensland heatwaves of recent decades are described followed by an assessment of the performance of the heatwave forecast service over the past three warm seasons (November to March in 2013-16).
A Queensland heatwave climatology
The dataset used is derived from the Bureau’s current operational low-resolution (0.25°×0.25°) daily temperature analyses (Jones, Wang & Fawcett 2009). The description is based on calculations of the average number of heatwaves, severe heatwaves and extreme heatwaves per year. The comparison shows an increased occurrence of heatwaves and severe heatwaves across Queensland in the later period, compared with the earlier period. This change in the heatwave climatology correlates with an increase in demand for heatwave services experienced over the last decade. This has culminated in the release of the Heatwave Response Plan by Queensland Health2, which uses the Bureau’s heatwave service.
Figure 1: Average annual number of three-day periods with positive EHF (left 1958-2011, right 1986-2015).
Source: Bureau of Meteorology
Figure 1 shows the average annual number of heatwaves (i.e. three-day periods with positive EHF) across Queensland for the two study periods. The numbers are first calculated for each individual calendar year and then the annual results are averaged. In counting the number of three-day periods, overlapping periods are counted separately. For example, a heatwave extending over four days is counted as two three-day periods, three three-day periods for a five-day heatwave and so on. In the first period, the average number of heatwaves was 14.8 per year averaged across Queensland, while in the second period it was 18.5. The spatial pattern remains fairly similar with higher numbers in the south and on Cape York Peninsula and lower numbers in between.
Figure 2: Average annual number of three-day periods with EHF greater than EHF85 (left 1958-2011, right 1986-2015).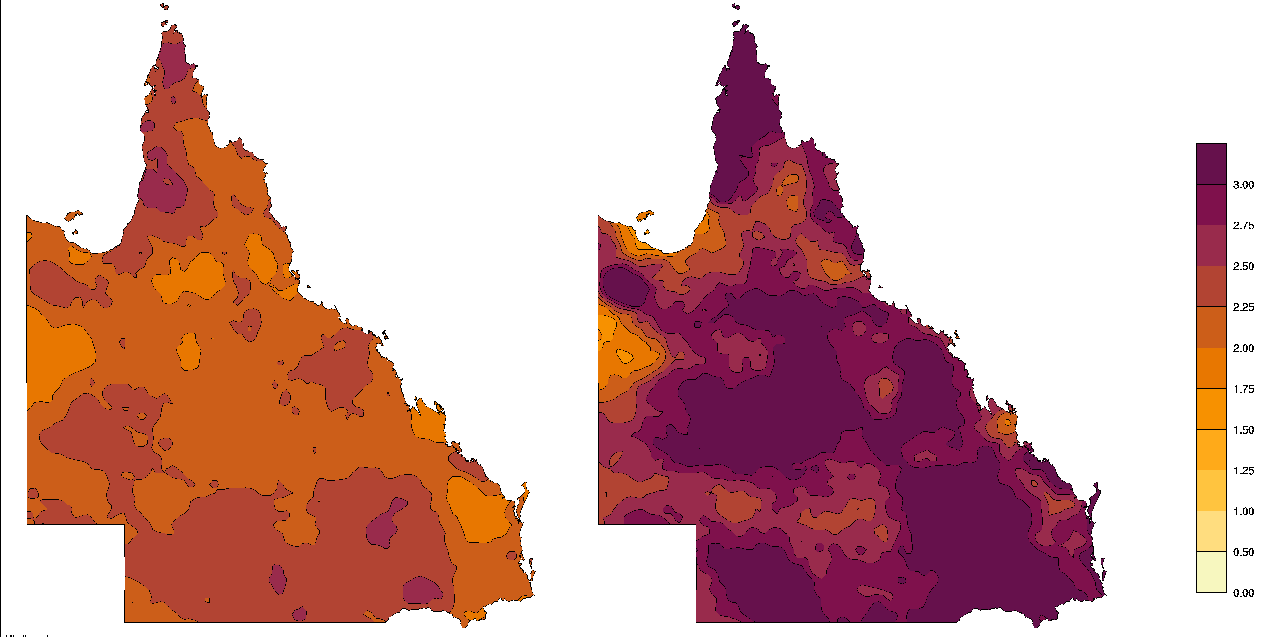
Source: Bureau of Meteorology
Figure 2 shows the average annual number of severe heatwaves across Queensland for the two study periods. The counting of severe heatwaves is done in the same overlapping way as for all heatwaves. In the first period, the average number of severe heatwaves was 2.2 per year, averaged across Queensland, while in the second period it was 2.9. Over the 30 years 1986 to 2015, a substantial fraction of the state has experienced three such events per year on average.
Figure 3: Average annual number of three-day periods with EHF greater than 3 EHF85 (left 1958-2011, right 1986-2015).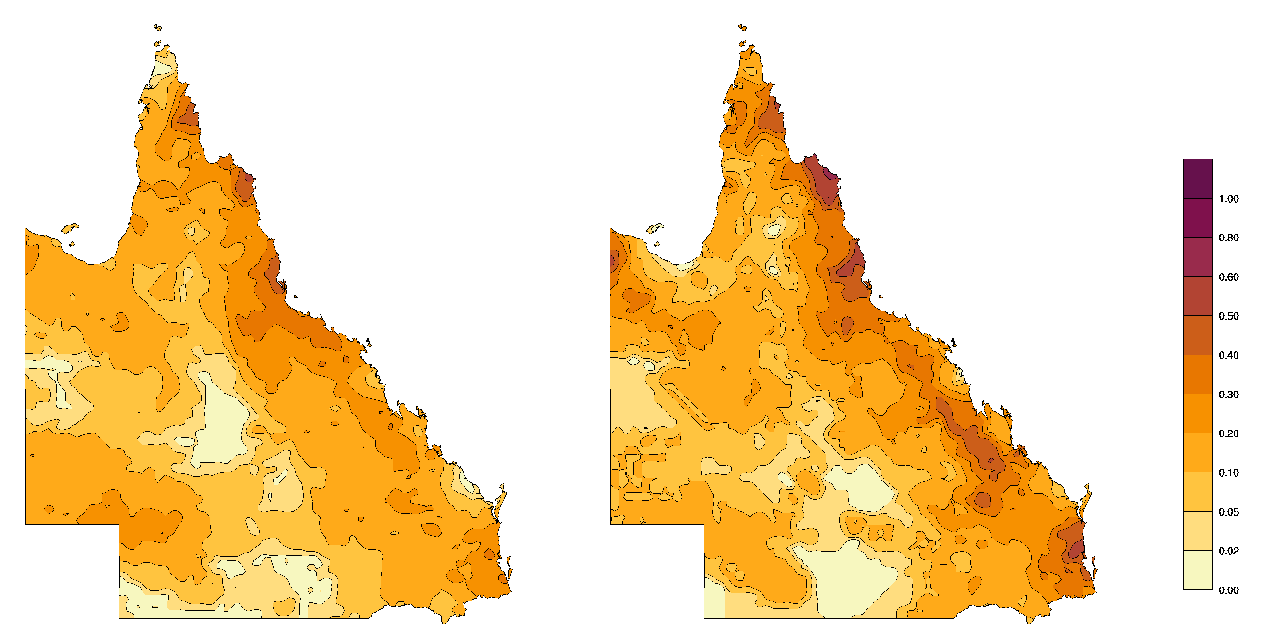
Source: Bureau of Meteorology
Figure 3 shows the corresponding numbers for extreme heatwaves. Some of the highest frequencies of extreme heatwaves occur along the east coast of Queensland. In the earlier period, the average annual rate across Queensland is 0.13 events per year, with 0.16 events per year in the later period.
Some significant Queensland heatwaves
Results from three types of calculations help identify heatwave trends.
- The integrated positive EHF (e.g. Figure 4, left) involves summing the positive EHF values associated with each three-day period within the nominated month (or like period) and ignoring the negative EHF values.
- The highest EHF value for any three-day period within the nominated month is obtained and scaled with respect to EHF85 to compute a graded heatwave severity map (e.g. Figure 4, right). White shades indicate no heatwave activity within the nominated period. Yellow shades indicate that some heatwave activity was analysed but it did not reach severe levels. Lighter orange shades (i.e. L1 and L2) indicate that some severe heatwave activity was analysed but it did not reach extreme levels. Dark orange shades (i.e. severe L3 and L4 as indicated in the figure key) indicate that some extreme heatwave activity was analysed.
- Time series are extracted for representative locations (e.g. Figure 5, left) by interpolating the gridded data. In these graphs, the horizontal yellow line represents the threshold for a low-intensity heatwave, the horizontal light-orange line is the threshold for a severe heatwave, and the horizontal dark-orange line is the threshold for an extreme heatwave.
Heatwave December 1972
December 1972 saw extreme heatwave activity across the southern half of Queensland at the end of a major El Niño event. A band stretching from the Queensland, Northern Territory and South Australia borders across to the coast and down towards Brisbane and the far northeast of New South Wales showed peak heatwave intensities exceeding four times the EHF severe threshold. This qualified as an extreme heatwave (Figure 4).
Figure 4: Integrated positive EHF (left) and maximum heatwave severity level (right) for December 1972.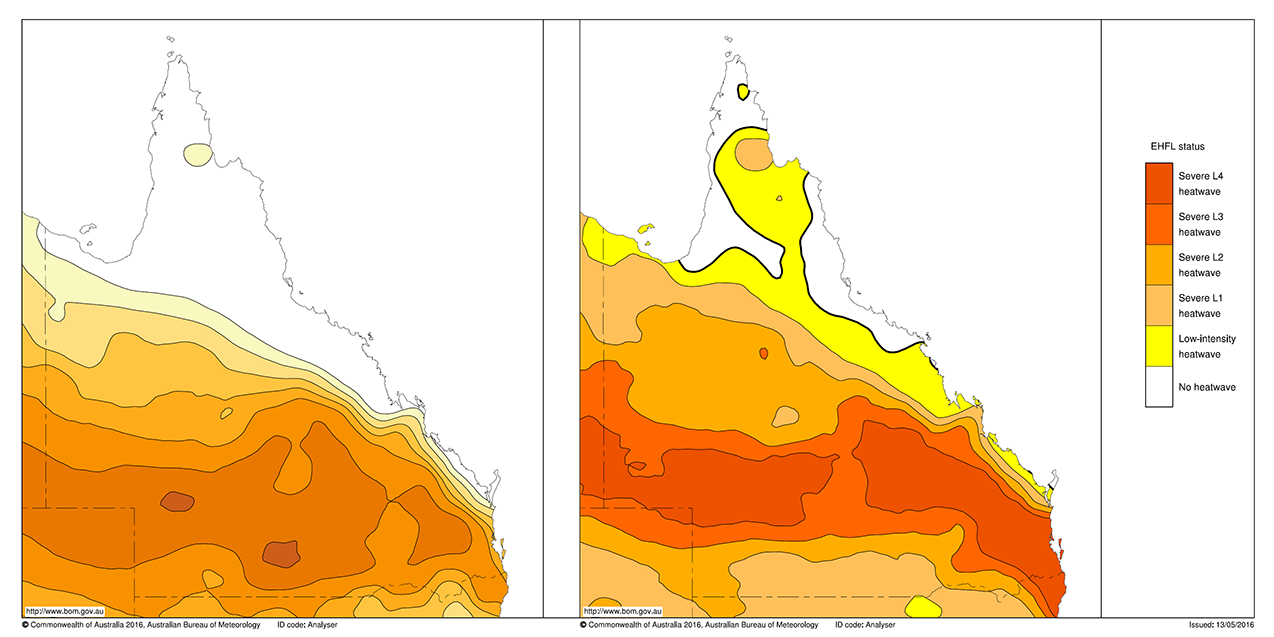
Source: Bureau of Meteorology
Extreme heatwaves in Australia normally affect multiple states and territories. Ninety-nine excess deaths were estimated across South Australia, New South Wales and Queensland (Attorney-General’s Department 2016). Figure 5 shows the progression of the heatwave in Brisbane together with the national heatwave severity map at the time of the peak heatwave intensity. The heatwave exceeded the local severe heatwave threshold by a factor of six.
Figure 5: Time series of EHF values at the Brisbane Regional Office, for the three-day periods 1-3 to 29-31 December 1972 (left) and the heatwave severity map for 23-25 December 1972 (right), the three-day period that represents the heatwave peak at Brisbane.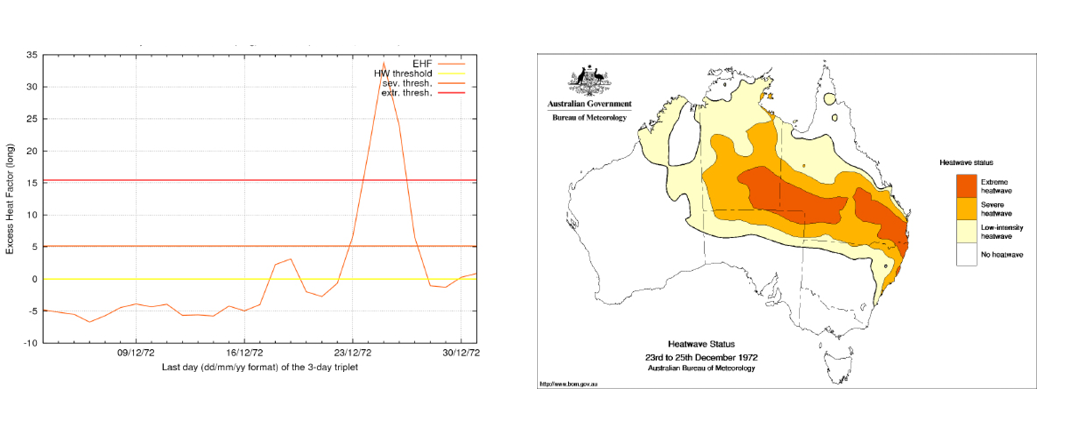
Source: Bureau of Meteorology
Heatwave February 2004
The peak signal of the heatwave of February 2004 was further south than that of December 1972, particularly in terms of the integrated EHF where higher values were recorded in South Australia and New South Wales (Figure 6). Even so, extreme heatwave intensities were analysed over southeast Queensland, particularly in the vicinity of Brisbane.
Figure 6: Integrated positive EHF (left) and maximum heatwave severity level (right) for February 2004.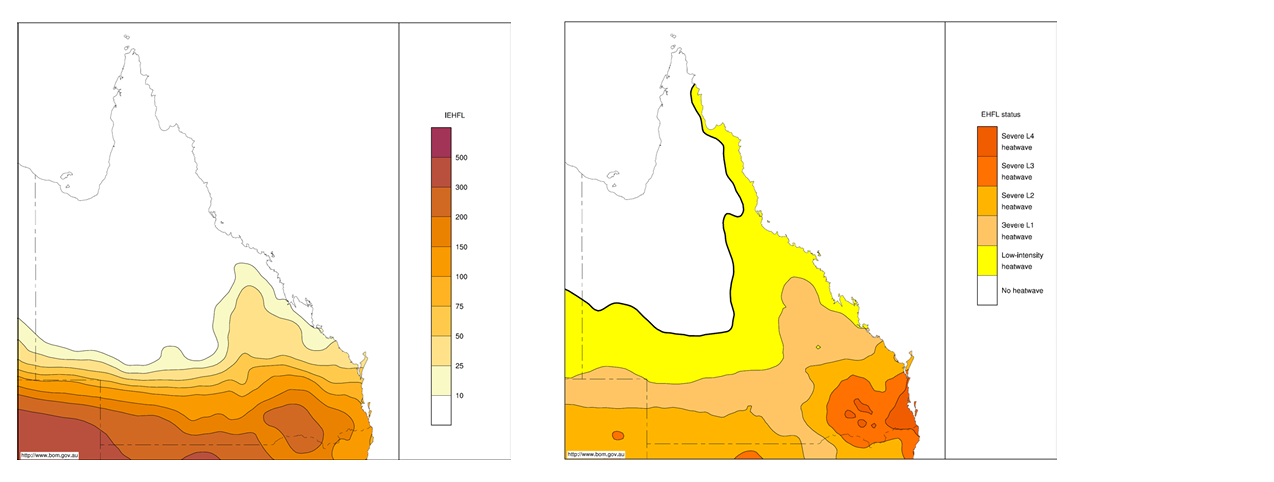
Source: Bureau of Meteorology
Modelling mortality rates due to heat stress estimated 116 excess deaths during 7-26 February 2004 in Brisbane (Tong, Ren & Becker 2010) corresponding to the location of highest heatwave severity shown in Figure 7. At Brisbane, three consecutive three-day periods (amounting to five days in total) were in the extreme range with EHF values rising to nearly five times the local severe heatwave threshold.
Figure 7: Time series of EHF values at the Brisbane Regional Office for the three-day periods 1-3 to 27-29 February 2004.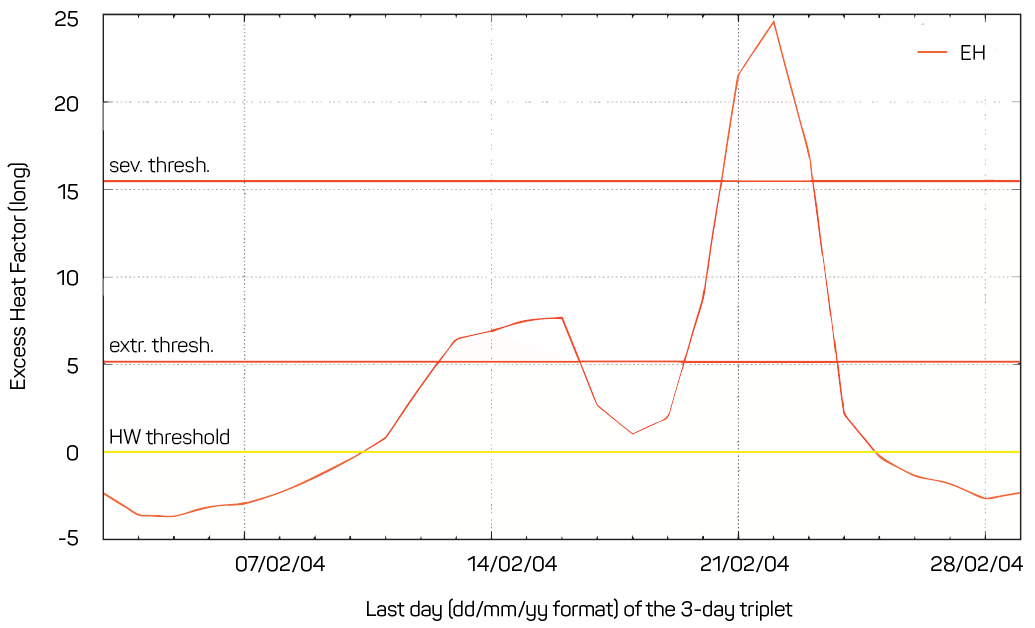
Source: Bureau of Meteorology
On Saturday 21 and Sunday 22 February 2004, the Queensland Ambulance Service experienced increases in calls of 28 per cent and 53 per cent respectively throughout the south-east of Queensland. This was its busiest day on record. The Ambulance Service reported on Monday 23 February that while ‘some cases were identified as specifically heat related, the bulk of calls were to people suffering from underlying medical conditions’ (Queensland Ambulance Service 2004).
Heatwave New Year 2014
Figure 8: Integrated positive EHF (left) and maximum heatwave severity level (right) for late December 2013 to early January 2014.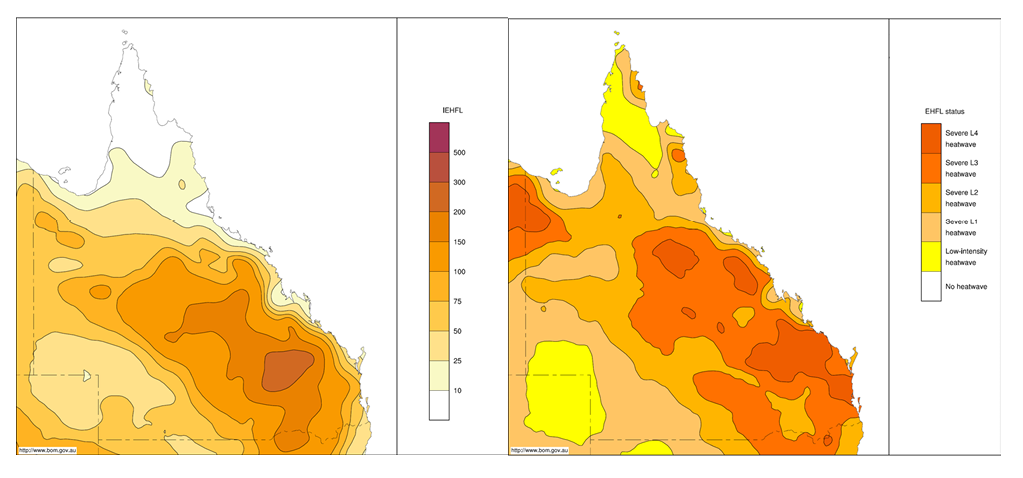
Source: Bureau of Meteorology
A heatwave peaking in the extreme range across parts of Queensland was recorded in late December 2013 to early January 2014 (Figure 8). While significant human health effects were recorded in southeast Australia in January 2014, there is little evidence of similar effects in Queensland. This could be attributed to effective messaging and warnings to the community over the threat posed (Englart 2014) or the delay in the assessment of excess- and medically attributable heat effects. There were however, well documented impacts on colonies of flying fox in south east Queensland. An estimated 45 500 flying foxes died in 52 of the 162 colonies assessed (Welbergen, Booth & Martin 2014). This is a significant event when compared to studies by Welbergen et al. 2008 that showed more than 30 000 flying foxes died in 19 such events in Australia between 1994 and 2008.
Heatwave November 2014
The heatwave of November 2014 had its peak integrated EHF in southern Queensland (Figure 9 left). In terms of peak severity, its impact was broadly spread across the state (Figure 9 right). This event, in the middle of the month, attracted international attention because of its proximity to the 2014 G20 Conference in Brisbane.
Figure 9: Integrated positive EHF (left) and maximum heatwave severity level (right) for November 2014.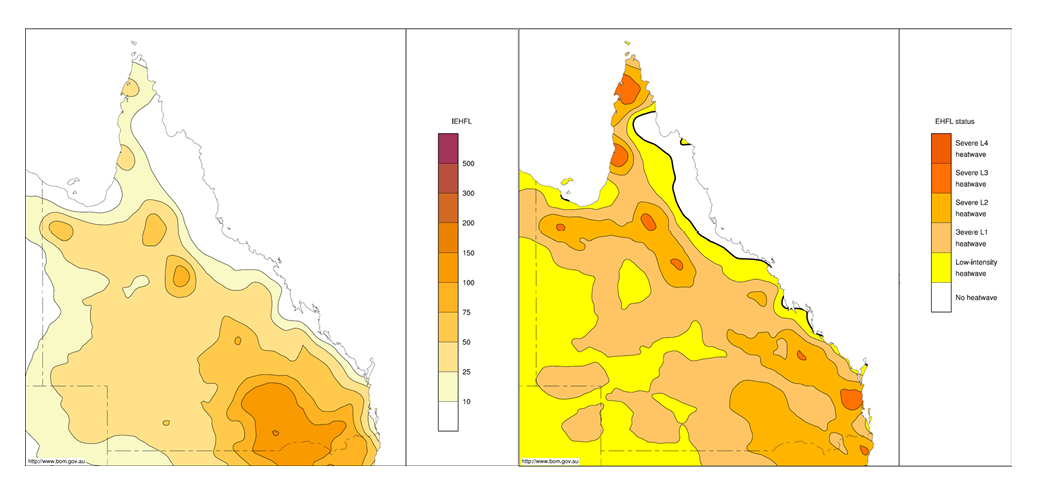
Source: Bureau of Meteorology
Similar to the January 2014 heatwave there has not been any public disclosure of the effects on the population other than the discomfort for G20 conference attendees (Edwards & Eaton 2014).
Forecast performance
The Bureau began issuing national heatwave severity forecasts in a pilot service on 8 January 2014. As the forecast service had been running internally throughout the entire warm season (November 2013-March 2014), the entire warm season was used in calculations. The pilot service ran again during the warm season of 2014-2015. By the warm season of 2015-2016 the service was fully established. The forecast performance for this first warm season has been described at the national scale (Fawcett & Nairn 2015). Here, the focus is on the forecast performance across Queensland for the three warm seasons of 2013-2014, 2014-2015 and 2015-2016.
Figure 10 shows a comparison of the total number of heatwaves (i.e. three-day periods with positive EHF) forecast at ‘lead time 1’ and subsequently observed across the warm seasons of 2013-2014 to 2015-2016. Here, ‘lead time 1’ means the three-day period forecast issued today for {today + tomorrow + the next day}. The spatial pattern of the observed events is captured in the forecasts. Across the three seasons, the state-averaged forecasting rate at lead time 1 was 85.61 events (hence an average rate of 28.54 events per season) compared with 84.0 events observed. Figure 11 shows the corresponding comparison for the number of severe heatwaves. The state-averaged forecasted rate was 14.35 events compared with 12.75 events observed.
Figure 10: Number of heatwaves forecast at lead time 1 (left) and observed (right) in the warm seasons of 2013-2014 to 2015-2016. The heatwaves represent three-day periods with positive EHF and are not necessarily non-overlapping.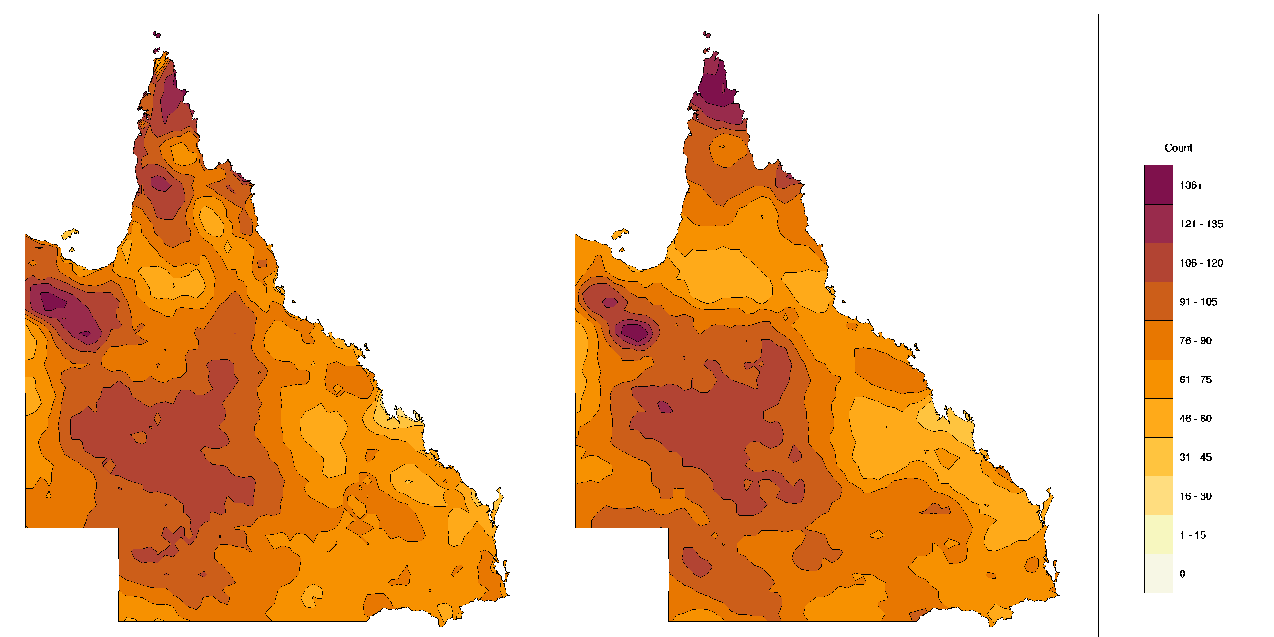
Source: Bureau of Meteorology
Figure 11: Number of severe heatwaves forecast at lead time 1 (left) and observed (right) in the warm seasons of 2013-2014 to 2015-2016.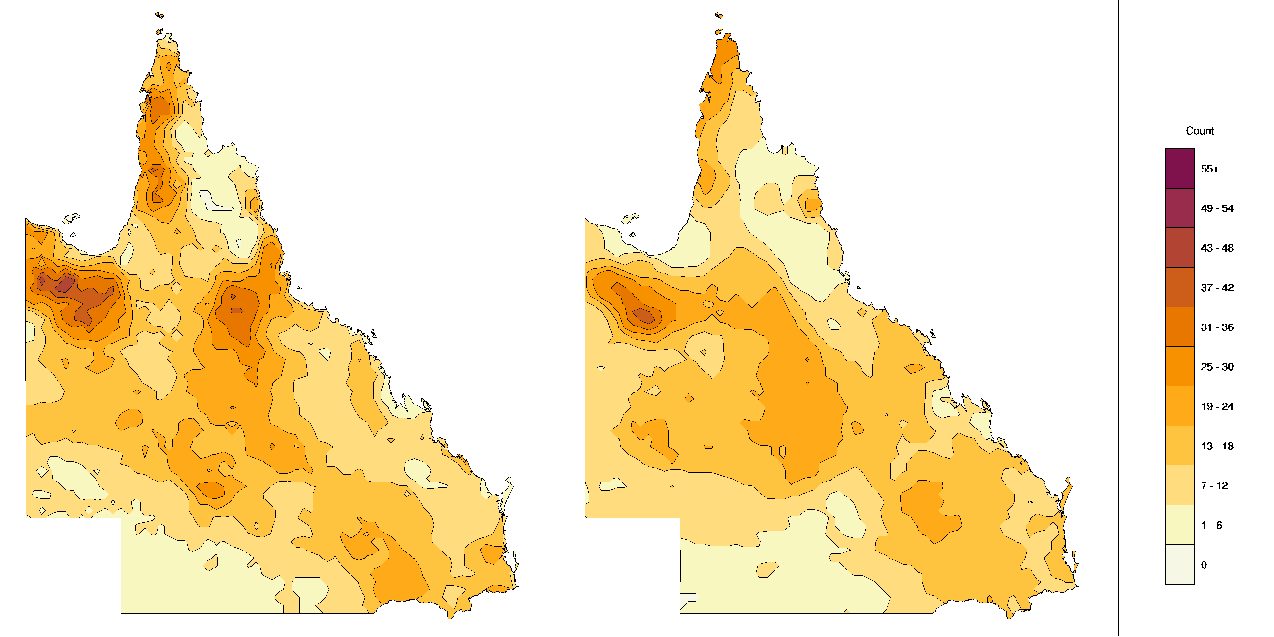
Source: Bureau of Meteorology
Figure 12 shows the percentage area of Queensland in heatwave conditions for each three-day period throughout the three heatwave seasons. The percentage areas forecast to be in heatwave conditions are also shown (coloured lines). Heatwave activity across Queensland throughout the heatwave season is episodic in nature. There are periods where a large proportion of the state is in heatwave conditions over several consecutive days, interspersed with periods when almost none of the state is in heatwave conditions.
Figure 12: Time series of the percentage area of Queensland in heatwave for the 2013-2014 (top), 2014-2015 (centre) and 2015-2016 (bottom) heatwave seasons (November to March).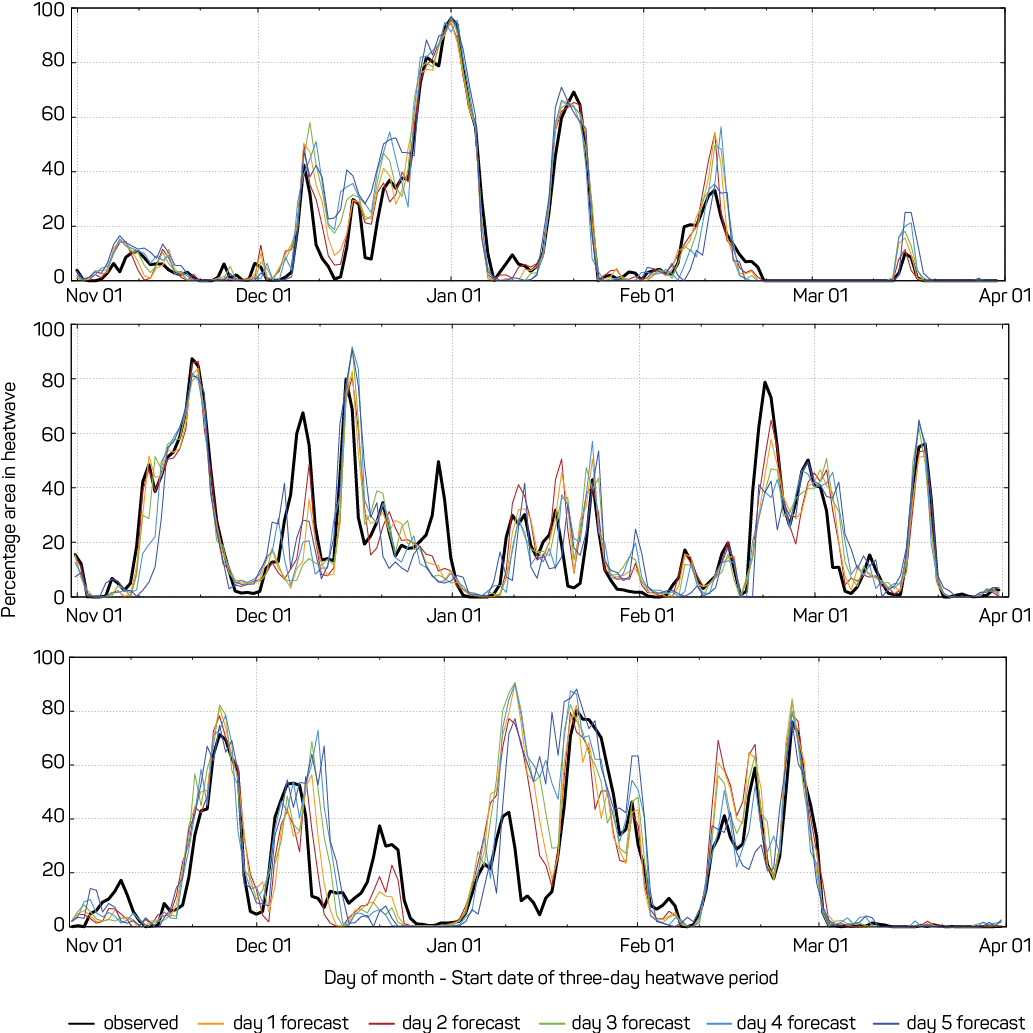
Source: Bureau of Meteorology
Each graph shows the percentage area observed (black lines) and corresponding forecasts (coloured lines; lead times 1 to 5). Red and orange colours denote shorter forecast lead times, blue colours longer forecast lead times.The performance of the heatwave forecasting system in terms of the percentage area is variable. Sometimes the extent of the heatwave is forecast extremely well, as in the two largest events of the 2013-2014 season. On other occasions, substantial over forecasting (e.g. the first half of January 2016) or under forecasting (e.g. the onset of the major heatwave of November 2014) can be seen.
Figure 13: Time series of the percentage area of Queensland in severe heatwave for the 2013-2014 (top), 2014-2015 (centre) and 2015-2016 (bottom) heatwave seasons (November to March).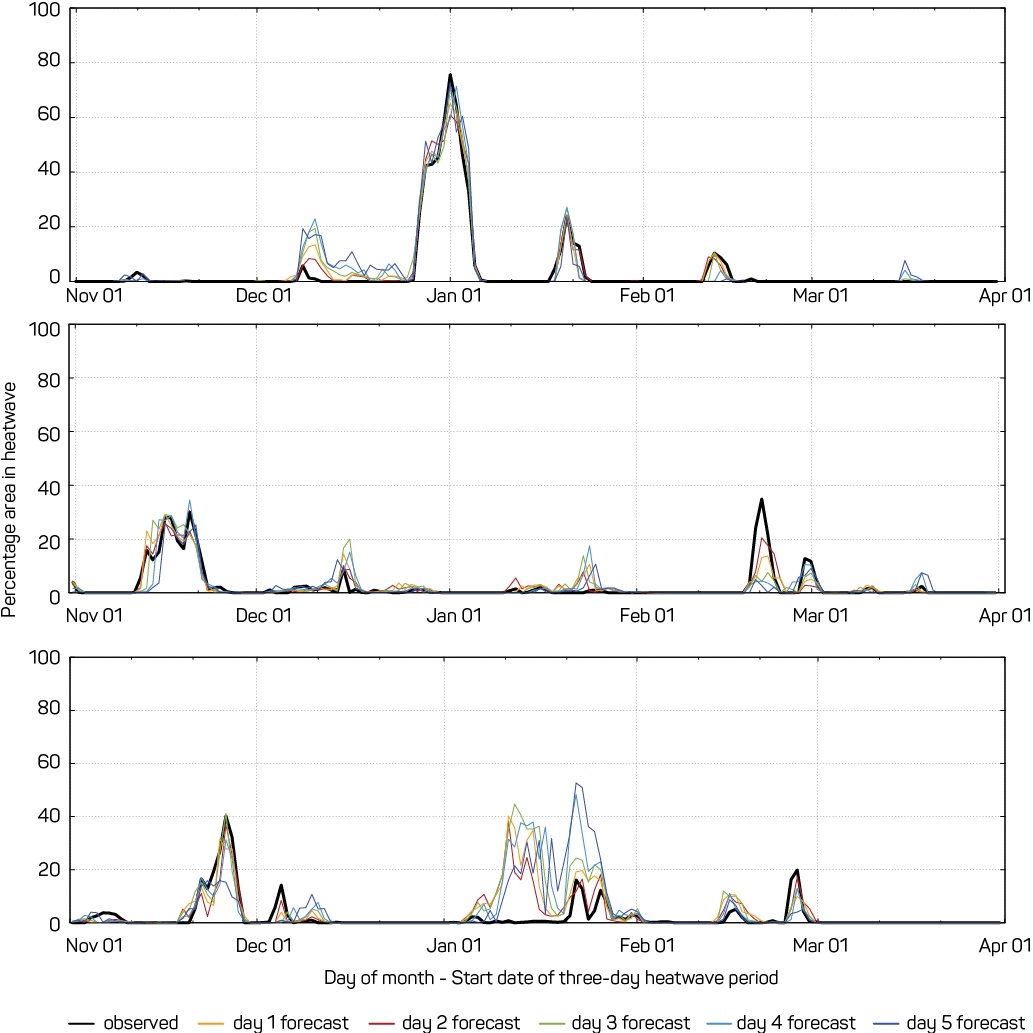
Source: Bureau of Meteorology
In terms of the percentage area of Queensland in severe heatwave, the performance of the forecast system (Figure 13) is similar to that observed. The severe heatwave around New Year 2014 was forecasted well, as was the November 2014 heatwave, although with under forecasting of the onset. Conversely, the peak intensity of the February 2015 heatwave was not captured in the forecasts, while January 2016 saw substantial over forecasting of severe heatwave activity. The poor performance in January 2016 is noticeably worse than in other cases, both for low-intensity and severe heatwaves. Reasons for this are not clear and warrant future investigation. Still, no episode of severe heatwave activity was missed entirely by the forecasting system.
Future heatwave services
Collaborative health studies in Australia and overseas are being used to test EHF skill as a predictor of heatwave impact. In combination with the growing understanding of heatwave climatology and demonstrated forecast skill in the heatwave service the Bureau has engaged with the health, emergency services and media sectors across Australia to establish the level of support for a national heatwave warning system. Federal, state and territory representatives from these sectors were invited to a National Emergency Management Project-funded workshop in October 2016. Regional health impact studies from Western Australia, South Australia and New South Wales were presented that demonstrated EHF impact forecast skill and explored principles required within a national heatwave warning framework. Attendees agreed to augment an existing heatwave services reference group established by the Bureau to assist in the ongoing development of this framework. The work of this reference group will be reported to the Hazards Services Forum (HSF). The HSF will be the national arena for jurisdictions at the highest operational level to consider the options provided by the reference group for implementation and development. It will allow a standardised service taking into account the requirements of community and industry disciplines such as health, transport and energy sustainability.
This work will be reported to the National Review into Warnings and Information working group3 to ensure that heatwaves information and warnings are developed within the evolving national multi-hazard environment.
Conclusion
This paper presented a climatology of heatwave severity across Queensland using the EHF metric for two periods; 1958-2011 being the period used to construct the associated gridded dataset and 1986-2015 representing the current climate. The latter period shows, on average, a higher incidence of heatwaves compared to the earlier period. Some significant recent Queensland heatwaves were described in terms of the EHF metric. Verification results were given for the performance of the Bureau’s pilot heatwave forecasting service.
Development of a national heatwave warning service has growing support across health, emergency services and media sectors. A proposed heatwave warning framework would seek national endorsement through the Hazards Service Forum. Once established the Bureau would engage partner agencies in creating a national heatwave warning service.
References
Attorney-General’s Department n.d., Heatwave December 1972. At: www.emknowledge.org.au/resource/624/1972/environmental---heatwave-dec-1972, [23 August 2016].
Edwards A & Eaton M 2014, ABC News. G20 Brisbane: World leaders swelter as locals hit the beach for long weekend. At:
www.abc.net.au/news/2014-11-14/g20-leaders-swelter-as-brisbane-residents-head-to-the-beach/5891494.
Englart J 2014, Extreme Heatwave hits Southeast Australia. Climate Citizen. At: www.takvera.blogspot.com.au/2014/01/extreme-heatwave-hits-southeast.html.
Fawcett RJB & Nairn JR 2015, The heatwaves of the 2013/2014 Australian summer. Proceedings of the Research Forum at the Bushfire and Natural Hazards CRC and AFAC conference. Wellington, 2 September 2014.
Jones D, Wang W & Fawcett R 2009, High-quality spatial climate data-sets for Australia. Australian Meteorological and Oceanographic Journal, vol. 58, pp. 233-248.
Nairn J & Fawcett R 2013, Defining heatwaves: heatwave defined as a heat-impact event servicing all community and business sectors in Australia. CAWCR Technical Report No. 060.
Nairn J & Fawcett R 2015, The Excess Heat Factor: A Metric for Heatwave Intensity and Its Use in Classifying Heatwave Severity. International Journal of Environmental Research and Public Health 2015, vol. 12, no. 1, pp. 227-253. doi: 10.3390/ijerph120100227
National Emergency Management Project 2016, National Extreme Heat Warnings: Investigating regional temperature triggers and responses. At: www.ag.gov.au/EmergencyManagement/Resilience-funding/National-Emergency-Management-Projects/Pages/National-Emergency-Management-Projects-2014-2015.aspx and
www.ag.gov.au/EmergencyManagement/Resilience-funding/National-Emergency-Management-Projects/Pages/National-Emergency-Management-Projects-2015-2016.aspx [20 December 2016].
Queensland Ambulance Service 2004, QAS Fact sheet - Heat wave (from 11am press conference). Queensland Government. At: www.ambulance.qld.gov.au/view.asp?id=581.
Scalley B, Spicer T, Jian L, Xiao J, Nairn J, Robertson A & Weeramanthri T 2015, Responding to heatwave intensity: Excess Heat Factor is a superior predictor of health service utilisation and a trigger for heatwave plans. Australian and New Zealand Journal of Public Health, vol. 39, no. 6, pp. 582–587.
Tong S, Ren C and Becker N 2010, Excess deaths during the 2004 heatwave in Brisbane, Australia. International Journal of Biometeorology 2010 July 54, no. 4, pp. 393-400. doi: 10.1007/s00484-009-0290-8
Welbergen J, Booth C & Martin J 2014, Killer climate: tens of thousands of flying foxes dead in a day. The Conversation. At: www.theconversation.com/killer-climate-tens-of-thousands-of-flying-foxes-dead-in-a-day-23227.
Welbergen JA, Klose SM, Markus N, Eby P 2008, Climate change and the effects of temperature extremes on Australian flying-foxes. Proceedings of the Royal Society of Biological Sciences. doi: 10.1098/rspb.2007.1385
About the authors
John Nairn is the Regional Director for South Australia and the National Heatwave Project Director at the Bureau of Meteorology. Development of heatwave services has motivated studies including collaboration in Europe and North America initiated through a Churchill Fellowship.
Dr Robert Fawcett is a climate scientist at the Bureau of Meteorology in Melbourne working in the areas of climate monitoring, heatwave studies and high-resolution modelling of severe weather events.
Footnotes
1 Excess deaths relate to the number of deaths in excess of the average number expected for the time of year and the region, based on data from other years.
2 Queensland Heath 2015, Heatwave Response Plan: an annex of the Queensland Health Disaster Plan. At: www.health.qld.gov.au/__data/assets/pdf_file/0032/628268/heatwave-response-plan.pdf.
3 National Review Review into Warnings and Information. At: www.emv.vic.gov.au/publications/national-review-of-warnings-and-information.