Abstract
Tropical Cyclone Debbie, a Category 4 cyclone, crossed Australia’s coast in North Queensland on 28 March 2017. Over three days, the cyclone travelled south across Queensland weakening to a low-pressure weather system. The event caused significant flooding and damage to communities. Formal sources of information related to this event included the Bureau of Meteorology and emergency services providers as well as informal sources from state-based traditional media and stct media sources of Twitter and websites. This paper is based on findings of a small study to identify the differences in weather prediction information between those formal and informal sources using the Cyclone Debbie major weather event, which invoked a disaster response. This paper identifies issues associated with the dissemination and reporting of weather-based information during emergencies. These include the language used in official sources that can confuse or downplay events, inconsistent reporting between authority and non-official sources and the lack of locally based information used by non-traditional information providers.
Introduction
The use of social media and its efficacy as a means of communication is now well recognised in disaster research and management. In recent years, the Bureau of Meteorology (BOM) has been establishing a presence on social media after an acknowledged slow start using the technology (Zion 2017). While the BOM restricted initial forays into Twitter by delivering forecasts, Zion (2017) noted that BOM executives are using social media and real-time data during severe weather events to inform emergency response decisions. Despite efforts of official sources to engage with members of the public and within specific communities via social media, effective communication during emergency situations and disasters remains a challenge. A lack of preparedness emerged as an issue for residents of Queensland during and immediately after Tropical Cyclone Debbie in March 2017 (Office of the Inspector-General Emergency Management 2017, Cullinan 2017).
Tropical Cyclone Debbie crossed the coast near Airlie Beach in Queensland and took an inland track before heading back out to sea south of Brisbane. Rain from the cyclone created devastating floods in the Fitzroy River Basin in central Queensland and throughout South East Queensland and northern New South Wales. Interviews with people who were affected by Cyclone Debbie highlighted issues associated with disaster preparedness. Cullinan (2017) reported on resident responses:
She says even though she felt she was prepared and had been listening to the warnings about Cyclone Debbie’s approach it wasn’t until the river they live by burst its banks that it really hit her.
He says he didn’t even see what was coming…‘Be over-prepared. We did a lot here to try and be prepared because in 1954 [the last flood] only barely came through here, and that was before the levy bank was put in, so we honestly never thought we’d get as high as it did,’ he said.
(Cullinan 2017, p.16)
These comments raise many questions. If those affected thought they were prepared, why did it eventuate that they were not prepared well enough? What information was being provided to the public? What were the warnings? How were they conveyed? What sort of system was Cyclone Debbie when it passed through Brisbane?
To answer these questions, this study explored the accuracy of information provided to inform the public during this event. Weather data, public warnings and emergency information provided by official weather sources were compared with unofficial weather-based sources that were popular on social media platforms.
Method
The aim of this study was to identify the differences in weather prediction information between formal and informal sources using Cyclone Debbie as a case study. This research was based on critical social enquiry, which underpins research to move beyond simple understanding and consider ways to influence action. The first step was to document and analyse weather warnings from the official sources. This information was compared with information disseminated by enthusiasts; those who communicated with one another via social media-based weather interest groups as well as media sources (traditional and non-traditional).
As defined by the BOM Severe Weather Warning Service (BOM 2017b), severe weather warnings are issued when there are expectations of:
- sustained winds of gale force (63 km per hour) or more
- wind gusts of 90 km per hour or more (100 km per hour or more in Tasmania)
- very heavy rain that may lead to flash flooding.
One of the typical weather patterns that can trigger a severe weather warning is ‘a recently decayed tropical cyclone moving inland or into southern regions’ (BOM 2017b).
Weather data provided by the BOM was used to construct graphs and diagrams to quantify the weather event of 30 March 2017. The illustrations were used to determine the accuracy of the weather warnings in hindsight. The Bureau provided one-minute average wind speed, maximum wind gust speed, wind direction, mean sea level pressure and accumulated rainfall from automatic weather stations. The Bureau also provided rain rate weather radar and geostationary satellite images for 30 March 2017. These were used to illustrate the extent of the weather event and to document vorticity components of the low-pressure system. The resultant graphs and diagrams provided the context for understanding prior official warnings for South East Queensland on 29 and 30 March 2017 as well as the news and social media reporting that followed.
Coverage of traditional media (print, radio, television and online news) and non-traditional (social media, blogs and social news) sources was collected. The ABC and Courier-Mail were selected as the major media outlets in Queensland; the ABC having a state-wide focus with local bulletins and the Courier-Mail being focused on Brisbane as the city’s major metropolitan daily news outlet. An initial search was conducted using the Dow Jones Factiva database. Outlets were ABC (all sources) and Courier-Mail (all sources). Date range of articles was 28 March to 30 March 2017. Search parameter was ‘cyclone debbie’. This identified 50 Courier-Mail articles and 74 ABC articles. The search was refined and only articles mentioning ‘south-east Queensland’ or ‘Brisbane’ were retained for analysis. In total, 23 Courier-Mail articles and 31 ABC articles were analysed. The analytic method used was discourse analysis, which supports a critical approach and is a common analytic method in media studies (Gill 2018).
Coverage of social media included messages distributed via Twitter, which was the focus of analysis for nontraditional media sources. According to Bouvier (2019), Twitter is recognised for its role in disseminating information as it happens and journalists source and produce news from its content. For this study, search terms were #cyclonedebbie, #TCDebbie and #exTCdebbie. All tweets using these hashtags between 28 and 30 March 2017 were searched when referenced to South East Queensland or Brisbane to retain consistency with the traditional source data. In addition, Higgins Storm Chasing, the most followed non-official weather-based Facebook site in Australia, was also examined as a non-official information source. The same search terms were used.
Findings
Cyclone Debbie as a weather event
In its monthly weather report, the BOM noted that March 2017 was a warm month based on climate averages across Australia. It was the third warmest March since temperature records commenced (BOM 2017a). This scenario meant that atmospheric and sea surface conditions were conducive to the formation of Tropical Cyclone Debbie on 25 March 2017. After three days, the powerful Category 4 cyclone crossed the Whitsunday coast causing extensive damage to property and forest areas near Airlie Beach (Figure 1). Hamilton Island, off the coast from Airlie Beach, bore the brunt of the storm and experienced peak wind gusts of 263 km per hour (BOM 2017a).
Cyclone Debbie weakened as it tracked inland of the central Queensland coastal ranges (Figure 2) creating extensive flooding in the Fitzroy River Basin that affected multiple towns. By 29 March, Cyclone Debbie had weakened to below tropical cyclone strength, however, continued a gusty southerly path past Collinsville.
The mean sea level pressure chart shown at Figure 3 indicates the location of the weather system at around 10:00am 30 March 2017.
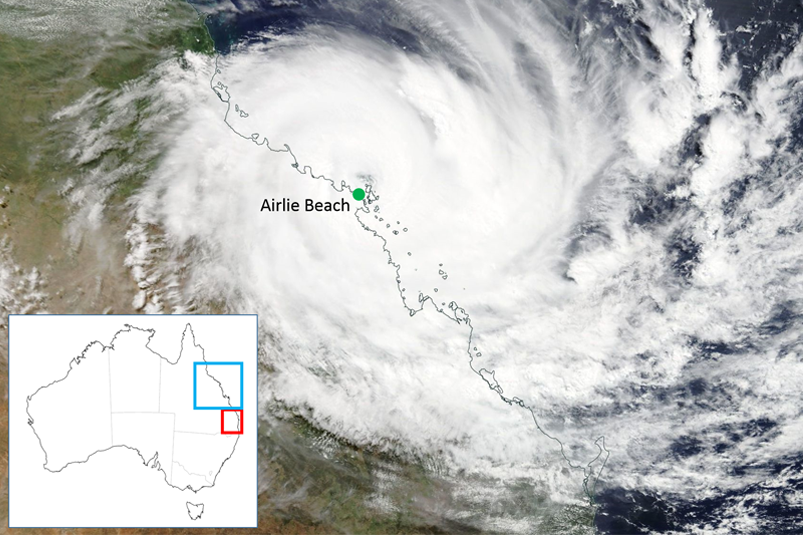
Figure 1: Tropical Cyclone Debbie crossed the coastline over Airlie Beach causing extensive damage to property and forest areas. Source: NASA 2017
The extensive low-pressure structure turned south-east during 30 March 2017 and arrived through the northwest of Brisbane that evening. The remnant system and associated severe thunderstorms, lashed South East Queensland (BOM 2017a) with gale force winds (Figure 3) before passing out to sea south of the Gold Coast. In the following days, torrential rain led to extensive flooding in South East Queensland and north-east New South Wales.
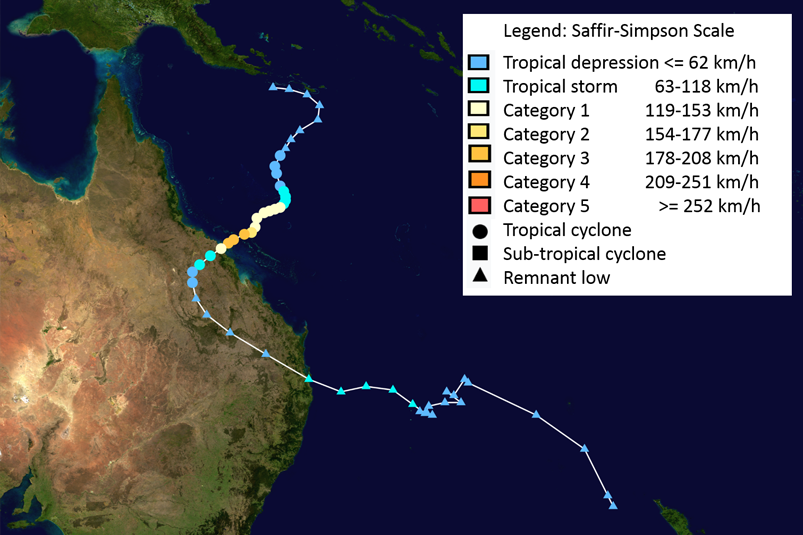
Figure 2: Cyclone Debbie tracked inland and caused significant flooding in the Fitzroy River Basin before heading south-east. Source: NOAA 2017
According to the BOM cyclone classification standard based on wind speed values, Tropical Cyclone Debbie was a tropical low as it passed through South East Queensland with wind speeds less than that of a Category 1 tropical cyclone. However, measurements of wind gusts (Figure 5) show that unusually strong winds (or gales) struck the region. The weather system also exhibited some vorticity structure usually associated with a cyclone. A cyclone-like ‘eye’ feature was evident in the Mt Stapylton rain radar images (Figure 4) as the system passed through South East Queensland that confounded weather observers.
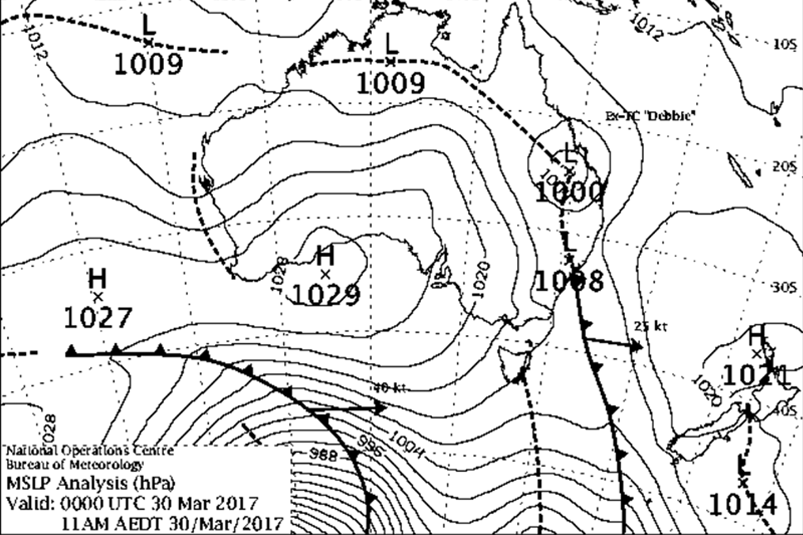
Figure 3: Mean Sea Level Pressure Chart at 10:00 am 30 March 2017. Source: BOM 2017b
Automatic weather station measurements (Figure 5) show that the wind direction changed 120 to 180 degrees in the proximity of peak wind gusts as ex-Tropical Cyclone Debbie made its transit through South East Queensland. Together with mean sea level pressure changes, the presence of local-scale weather system vorticity normally associated with deep lowpressure, high-speed wind systems was evident close to Brisbane. Analysis shows that a second low-pressure centre developed ahead of the original core of the cyclone (Turner 2017) passing over the Sunshine Coast as a rare Mesoscale Convective Vortex. The twin system interactions brought ‘cyclone-like’ severe wind gusts to South East Queensland to the surprise of residents and emergency services agencies and authorities.
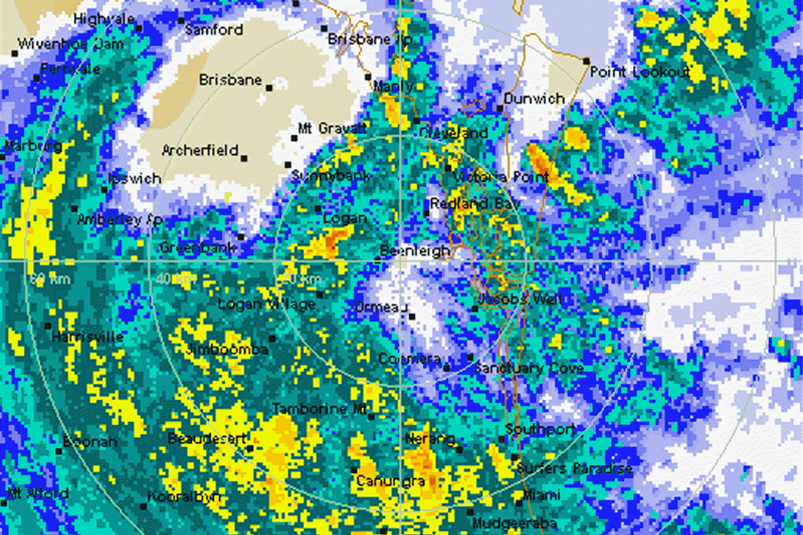
Figure 4: Mt Stapylton weather radar rain image exhibiting some vorticity structure over Brisbane. Source: BOM 2017c
Weather warnings
Information provided by the BOM Climate Data Services show that the BOM Queensland Regional Office issued a severe weather warning for coastal and hinterland central Queensland regions at 2:58 am on 29 March 2017 noting damaging winds and heavy rain. This warning was the first indication that the severe weather system associated with a weakening Tropical Cyclone Debbie, would track south-eastwards during 30 March. At 5:16 am, the severe weather warning noted the possibility of flooding in the south-east corner of Queensland and damaging winds around Fraser Island for the next day. At 9:15 pm on 29 March, the severe weather warning advised that winds in excess of 125 km per hour would develop in South East Queensland coastal districts from the afternoon of 30 March. Multiple warnings and cancellations were issued by the BOM Queensland Regional Office on the morning of and during 30 March. At 5.15 am, a severe thunderstorm warning was issued followed by cancellation notices at 6.31 am, 6.33 am and 6.34 am. The next severe thunderstorm warnings for South East Queensland were issued at 11.33 am and 12.05 pm, followed by a cancellation at 12.24 pm. Further severe warnings throughout the afternoon of 30 March were issued by the BOM for areas ranging from the Gympie region to the southern coast. These indicated severe winds and heavy rainfall.
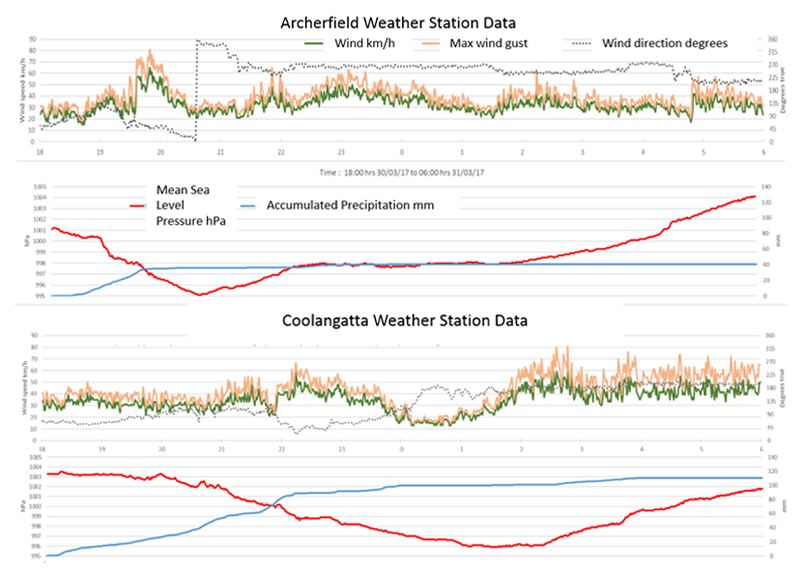
Figure 5: BOM Archerfield and Coolangatta weather station graphs for 30 March 2017. Source: BOM 2017d
Warnings via traditional media
This study revealed three issues in the traditional media reporting that were worth further investigation. These were:
- the choice of language used
- the inconsistent reporting of the event
- the inconsistent use of hashtags in social media.
It was identified that language was ‘softened’ and, at times, inconsistent with official warnings. Reporting of technical forecast information was inconsistent and there was minimal mention of winds being potentially dangerous and wind information in forecasts and reporting was not prioritised. This study did not delve into how journalists determine what to report, however, it did raise questions as to what emergency services organisations might do to influence reporting to maintain quality and consistent information.
Analysis of social media reporting showed that local information was blurred by the state-wide approach to coverage and there was a lack of coordination between agencies associated with coordination and management. This resulted in inconsistency when using hashtags and disseminating information.
‘Soft’ and inconsistent use of language
Language used by official sources reported in traditional media potentially represented a ‘hedging bets’ approach despite being accurate. An example from an ABC report (Agius 2017) follows (underlining for emphasis):
BOM forecaster ((name removed)) said ex-Cyclone Debbie was continuing to weaken and would move fairly quickly to the south-east by Thursday.
Brisbane and surrounds could receive up to 200mm in 24 hours, with the worst of it on Thursday night. The monthly March average is 138mm.
The falls will not be enough for a repeat of the 2011 Brisbane River flood.
“We have had quite a dry summer, so there isn’t a build-up of moisture in the catchments to allow that,” he said.
“It is quite a different set-up.
“We don’t have an upper trough which sat above us [in 2010–2011] for a couple of days which provided a lot of rain.
“This one is quick moving and will clear up by the weekend, there will not be a repeat of the 2011 weather event.”
In this example, the forecaster is not only predicting the weather but comparing the event to past events, possibly in response to questions from a journalist that attempts to make sense of the event for the public. While the statements were technically correct, it was not a repeat of the 2011 weather event and is problematic if it influences public expectations. Other examples of this language include:
Authorities also warn that the remnants of Cyclone Debbie may cause flooding and torrential rain around the Wide Bay and South East Queensland regions next week.
(Courier-Mail, 28 March 2017 (Honnery 2017))
We will have a lot of moisture coming down with the remnants of Debbie and that’s what will be driving most of those showers,’ he said. ‘(The flood watch) is just a preliminary product to give people a heads up.’
(Courier-Mail, 29 March 2017 (Honnery & Akers 2017b))
The use of superlative language was also identified as potentially problematic. For example:
Meteorologists said a month’s worth of rain could be dumped on some areas, including Brisbane, which averages 109.77mm for March.
(Courier-Mail, 29 March 2017 (Honnery & Akers 2017b))
While descriptive, a ‘month’s worth of rain’ is not a well-defined amount. A lay audience would most likely not be familiar with what ‘a month’s worth of rain’ might look like. As a result, the use of such terms can prove meaningless and not have the desired effect on audiences. This phrase was also reported in ABC coverage the same day (Agius 2017).
Inconsistent technical information
The study showed that technical information was inconsistent. For example, the ABC and the Courier-Mail reported on 29 March 2017:
Courier-Mail: ‘Up to 150mm of rain is forecast to hit the region as early as tonight, lasting until the weekend.’
(Honnery & Akers 2017a)ABC: ‘South-east Queensland is set for a drenching today with rainfall in excess of 200 millimetres possible in some localised areas, the Bureau of Meteorology warns.’
(Agius 2017)
Wind gusts were reported as up to 60 km per hour in the Courier-Mail and 100 km per hour in ABC reporting on the same day. Wind forecasts were downplayed and qualifiers were used to soften language. For example:
Meteorologist ((name removed)) said strong winds of up to 60km/h would hit the South East.‘It will be windy, maybe 20–40km/h and possible gusts up to 60km/h but that’s not going to cause any major damage,’ he said
(Courier-Mail, 29 March 2017 (Honnery & Akers 2017b))
Alternatively, mention of wind gusts occurred later in the body of the story, where less important information is usually found in news reporting:
‘At this stage we’re looking at 100kph wind gusts particularly around exposed coastal areas and coastal ranges.’
(ABC 2017)
Social media warnings and inconsistent hashtags
The study showed use of inconsistent hashtags in social media messaging. Variants included #TCDebbie (used by Queensland Police Service and Higgins Storm Chasing), #CycloneDebbie (used by the BOM and Queensland Police Service), #exTCdebbie and #TCDebbie. The hashtags #TCDebbie and exTCDebbie were used by state politicians (George Christensen MP and Jacki Trad MP), news organisations (Sky News and ABC Brisbane), emergency services organisations (Brisbane City SES) and local councils and councillors (e.g. Luke Smith). Some provided very specific local information.
Analysis of Twitter-based reporting showed it was difficult to ascertain the relationship between a message and to whom it was relevant. Tweets did not indicate where flooding may occur nor for whom the flood would be hazardous, for example:
@ABCEmergency: ‘We’ve had reports of over 300mm since 9 am yesterday … so there is a real risk of flooding.’ - @BOM_Qld’s Adam Blazak on #CycloneDebbie
@jessvanvonderen: @BOM_Qld says #CycloneDebbie will be a hazardous system for the next 24 hours @ ABCNewsBrisbane
Such a state-wide and generalised nature of information could be problematic given the localised flooding. Overall, the study showed citizens used #TCDebbie, which is consistent with the approach taken by state politicians.
Discussion
Findings in this study address questions raised in the report into preparedness for Cyclone Debbie (Office of the Inspector-General Emergency Management 2017). The report identified a difference in preparedness between northern and south-eastern Queensland communities. It noted that the impact of Cyclone Debbie on South East Queensland was greatest in the periurban rim, where council boundaries of Scenic Rim, Logan City, Redland and Gold Coast abut the Brisbane City Council boundary. The report identified centralised media and confusing and incorrect reporting as problematic (p.87), and that media campaigns using social media and radio were effective means for communicating with the public (p.58).
The report noted:
- community members sought information from local councils
- there is potential for councils to partner with the ABC
- there were issues associated with inconsistent and misunderstood terminology and news media coverage.
The report identified opportunities to link the sources of information communities use most (BOM and traditional media) more closely with official information from local and state governments as well as emergency services agencies. The report noted that ‘interviews or media conferences by mayors and elected officials were a successful way of engaging the public, and ensured that the information provided was seen as authoritative’ (p.85). However, authoritative information that is inconsistent or confusing has potential to be more dangerous than messages from unofficial sources.
This research illustrates some of the issues referred to by sources cited in the report. It suggests that work is required in the areas of message delivery and language choice, consistency in message content and hashtag address use as well as improved localisation of information.
News media training, which has been a ‘go-to’ solution in the past, needs other approaches to improve emergency communication in all its phases. Community members are bypassing traditional news media for official information from the source. Training for staff who post to social media and in public forums may address some of the problems identified in this study. To illustrate, a hashtag cue promulgated by the Crisis Communication Network in the preparatory and emerging stages of an event, could promote consistent use of hashtags across all levels of government, news media and emergency services organisations’ social media information. This may address recommendations for public information management that: ‘information should be searchable, more specific, timely and allow stakeholders to find what they want.’ (Office of the Inspector-General Emergency Management 2017).
This study identified the benefit of examining messages using discourse analysis more holistically and in detail. It is not enough to simply explore the use of social media platforms. Examining broader interaction between media sources may provide clarity as to how responsible organisations can improve warnings and preparedness messages before, during and after an emergency. For example, the Digital Media Report 2018 produced by the University of Canberra identified that news consumers in regional areas rely more on offline platforms, particularly television news, and almost twice as much on local and regional newspapers for news than urban consumers (Park et al. 2018, p.9). The report also noted that news consumption via mobiles is lower among regional news consumers, indicating that internet connectivity is potentially a factor when accessing online news. Contextual factors therefore influence the way people seek and access information they believe to be important to them. What happens when local and regional newspapers are accessible only by subscription and disaster-related information is not immediately available? What are the implications when the only accessible news-based information for regional communities is via state-wide coverage by offline platforms, such as ABC radio? What happens when access to offline platforms is limited and the easiest way to access information is via social media? In this context, there is a need to consider how people use information, particularly as media information is centralised despite the need for localised information (Office of the Inspector-General Emergency Management 2017). Addressing this would allow for human factors to be considered, such as the way people use social media collectively, during information dissemination (see Palen & Hughes 2018).
Conclusion
Researching inconsistencies that occur when disseminating accurate information via official weather sources has the potential to improve analysis and communication processes. The information assists continuous improvement undertaken by governments and emergency services organisations as well as the Queensland Inspector-General of Emergency Management’s Lessons Management Plan. This is increasingly important when centralisation of media and government reduces the frequency and specificity of local information. This can impact on regional and peri-urban communities who may be at greater exposure to disaster events; these communities often have limited (or no) locally based media or immediate source of information aside platforms such as Facebook. This is particularly problematic when weather systems are likely to be large, fast-moving and complex as was the case with Tropical Cyclone Debbie. In the absence of information, people will look for information from multiple sources. Maintaining consistency of messaging and preparedness information would be of interest for future research.