Abstract
The Bureau of Transport Economics (BTE) 2001 report, Economic Costs of Natural Disasters in Australia (BTE 2001), has been the only comprehensive, national assessment of the economic impacts of disasters in Australia. Statistics and economic impact assessment methodology presented in the report have been widely used for research and policy analysis, particularly for assessing the costs and benefits of disaster risk reduction and mitigation. This is the case even though the data and analysis are over one and a half decades old. It has needed updating in terms of the approach to analysis and the dataset to include the many relevant disasters triggered by natural phenomena from 1999 to 2013. This paper sets out the approach used to update the 2001 report through a National Emergency Management Projects grant, documents the major issues faced, including the need for a new dataset and presents some results. The main differences between the BTE 2001 report and the update concern increase losses from bushfires, the inclusion of heatwaves, with heatwaves responsible for half of all deaths, and changes in the pattern of loss at the state level.
The need for a national disaster loss assessment
There is a strong demand for information on losses from natural hazards in Australia (Council of Australian Governments 2011). This information would help estimate the current and potential risks (Middelmann et al. 2007) and provide input into how government funding is distributed across states and territories for risk mitigation. This demand comes primarily from those responsible for policy and high-level disaster risk reduction and from those with budgetary responsibility. It also comes from the research community seeking to understand long-term trends that impact on losses such as climate change, population growth and shifts in the nature of economic activity (Handmer et al. 2012, Hallegatte 2014).
This demand has been partly satisfied by drawing on the 2001 BTE report and a variety of reports and studies into specific events for specific purposes (e.g. COAG inquiry: Ellis, Kanowski & Whelan 2004) and specific hazards (e.g. bushfire: Stephenson, Handmer & Betts 2013). There are also reports by the Australian Business Roundtable highlighting the scale of losses from natural hazards now and in the future (e.g. Deloitte 2013).
With goals such as distributing disaster mitigation funding across states and territories, it is desirable that analysis and decisions are based on up-to-date data. In terms of currently available Australian data, there are three main sets:
- A proprietary dataset held by Risk Frontiers, which is mainly concerned with insurance-related issues (e.g. Crompton & McAneney 2008).
- A dataset from the Insurance Council of Australia (ICA 2015) on insurance losses from 1967 to the present, which is publicly available as the ICA’s Catastrophe Database.
- The Emergency Management Australia (EMA) Knowledge Hub (formerly EMATrack, and now the Australian Disaster Resilience Knowledge Hub), which is a long-running Australian Government dataset on disaster loss in Australia.
The EMA Knowledge Hub is the most comprehensive, publicly available dataset, but at the time of writing was not suitable for trend analysis. This was because of changes to event inclusion criteria resulting in the total number of events changing on a few occasions, which raised doubts about its consistency over time (Power et al. 2013, Table 3). The ICA dataset is consistent but deals only with insurance payouts and no metadata is available. In addition, many agencies hold time-series data on losses from bushfires, among other hazards, but these are usually neither continuous in time or space, nor available outside the agency concerned. Of these sources, the 2001 BTE report has been the only publicly available consistent time series of full disaster loss by hazard and across all Australian jurisdictions. It is based on the ICA dataset and the EMA Knowledge Hub.
However, the BTE report is now very dated. To address this, an update project was funded by the Australian Government through a grant from the Risk Assessment, Mitigation and Management Committee of the National Emergency Management Projects program. The project updates the BTE results to present a current national picture of disaster costs, to check the loss data and to update, as necessary, the conceptual basis underpinning the analysis presented in the 2001 report. The update presents an authoritative analysis of disaster costs for Australia over time, by state and by disaster type. In doing this, the final report (Handmer, Ladds & Magee, in press):
- presents a national updated picture of disaster losses and trends
- identifies gaps and types of data that need attention for future improvements in loss assessment and provides a roadmap on how this could be done
- organises the dataset in a form that allows updating and analysis in future.
This paper sets out the main differences between the BTE report and the 2017 update by Handmer and colleagues. Major differences include a new disaster dataset and the application of full normalisation procedures to historic disaster loss data.
The 2001 BTE report
The 2001 report provided a national picture by state, hazard and over time, of the costs of disasters triggered by natural hazards in Australia from 1967 through to 1999. The report used a disaster loss dataset compiled by Emergency Management Australia, known as EMATrack (now hosted by the Australian Institute for Disaster Resilience as the Australian Disaster Resilience Knowledge Hub). The data were based on the ICA’s disaster data, which set out insurance payouts for Australian disasters from 1967 to mid-2015 (ICA 2015). The hazards included were defined by the scope of the Australian Government Natural Disaster Relief and Recovery Arrangements: storms, cyclones, floods, wildfires (or bushfires), landslides, tsunamis, storm surges and earthquakes. Droughts and heatwaves were excluded. Indirect and intangible losses were only partly assessed, although the cost of fatalities was included by drawing on the approach used in transport safety assessments (BTE 2000).
The new dataset: AUS-DIS
To undertake this project, a new database of disaster losses in Australia had to be developed to replace EMATrack, which was not suitable for trend analysis. The new database, AUS-DIS, is the basis of the project’s findings. It covers the period 1967 to 2013 and is transparent, replicable, easily updated and improved and publicly available.
The database draws on a number of local and international sources with metadata and clear sourcing and reliability estimates for each data-point. Using the threshold of AU$10 million (following BTE 2001) or three fatalities for inclusion in AUS-DIS, 310 disasters were identified and analysed for the period covered by the dataset (the $10 million threshold is based on the value of the Australian dollar at 30 June 2013). It is likely that there are other disasters that meet this threshold, but it is unlikely they would significantly impact on the results of this report because of their small losses and minimal fatalities. The database includes direct losses with some indirect losses and the intangibles of deaths and injuries. The AUS-DIS database is currently available via GitHub (Ladds, Magee & Handmer 2015) on request.
AUS-DIS includes the same hazards as the BTE (2001) report with the addition of heatwaves, albeit for deaths only. In addition to the new dataset, there are three major and a number of minor methodological changes from the BTE 2001 to the 2016 update.
- Loss estimates were developed from three approaches, two of which were used to construct the new database. These were:
- reported loss - event costs assessed from published material
- insurance with multipliers (as used by BTE) are used to construct AUS-DIS
- synthetic loss - the estimates compiled from the components of impact by sector and by direct, indirect and intangible. This approach remains under development.
- Metadata is used for each estimate and includes its source, reliability, accuracy, method of compilation, etc. The absence of metadata makes it difficult to assess the reliability of estimates or to see where improvements are most
- A key factor in time-series analysis is the normalisation procedure used to make the estimates comparable over time. The Consumer Price Index was used to correct for inflation as well as the use of population and wealth. Wealth was assessed using Gross Domestic Product.
Other methodological and data changes include the use of the Value of a Statistical Life concept based on work done by the Office of Best Practice Regulation (OBPR). The value recommended by the OBPR (2014) is $4.2 million. A serious injury was valued at $853,000, with $29,600 for a minor injury using an approach from the National Road and Motorists Association (NRMA, 2012). Results are shown by financial rather than the calendar year to accurately capture the timing of an event as the most costly events in Australia occur during or close to summer (December–February). Heatwaves are included where there were three or more deaths recorded. Data on other losses from heatwaves were not available for most heat events. Heatwave inclusion is important, even though data is limited to fatalities, because heatwaves result in more deaths than all other hazards combined, and because increasing heatwave severity and frequency are virtually certain with climate change.
Disaster losses now
Losses from disasters were $171.5 billion (including the costs of deaths and injuries) in 2013 prices during the period 1967 to 2013. The average annual loss from these disasters between 1967 and 2013 was $3.65 billion (including the costs of deaths and injuries). The use of a new database, full normalisation, some differences in values (such as a much higher value for fatalities) and some differences in analysis, mean that these dollar amounts are not comparable with the BTE report’s estimates.
However, within the context of the changes in approach between the two sets of data, the pattern of national loss is generally comparable, with some differences. Since 2000, Victoria is the state with the largest loss with 40 per cent of the total, overtaking Queensland and New South Wales. A significant shift in hazard importance is the loss from bushfire over the whole record. Bushfires now account for 16 per cent of the total, which is a large increase over the BTE estimate of seven per cent. (Note that percentages have been rounded to the nearest whole number.)
Numbers and costs of disasters
Between 1967 and 2013, there have been 310 natural hazard disasters with three or more deaths or costing greater than $10 million. This includes 32 events recording only deaths and injury with no other losses. There are 278 events with recorded dollar losses as well as human losses. Slight changes in inclusion criteria affect the number of small disasters in AUS-DIS, but these small events have no significant impact on overall losses.
Figure 1 illustrates the distribution of losses through time and highlights the disproportionate effect of large events. Disasters below $100 million contribute only four per cent of all losses, while disasters above $500 million contribute 81 per cent of losses. In terms of numbers of events, 41 per cent of disasters cost between $10 million and $100 million.
About one-third of the total loss can be attributed to about ten major events including Cyclone Tracy (1974), Ash Wednesday (1983), the Sydney hailstorm (1999), Black Saturday (2009) and the Brisbane floods (2011).
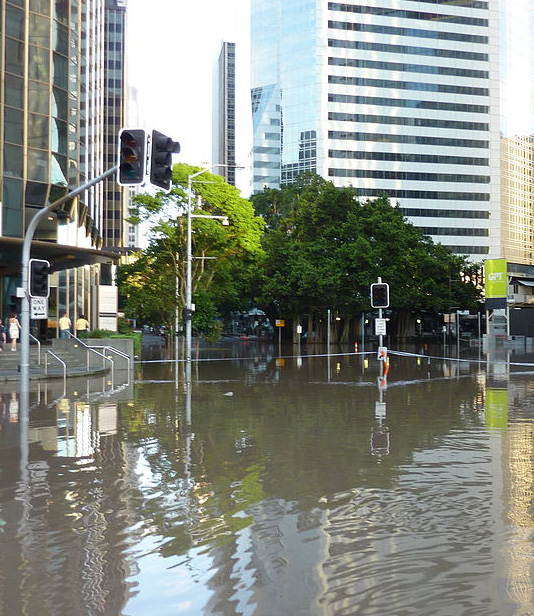
Flooding in Brisbane, Queensland, on 13 January 2011 brought the city to a standstill. Source: Andrew Kesper, CC BY 2.0.
Trends
There appeared to be an increase in the number of disasters over time in the raw data. This increase can be attributed to the increase in population. When adjusted for population increase, there is no statistically significant trend in the frequency of disasters. Similarly, there is no statistically significant trend in normalised losses through time, although there appears to be a slight upward trend in the last decade (Figure 1). These results confirm that socio-economic trends are key factors driving Australia’s disaster risk as noted elsewhere (e.g. IPCC 2012).
Deaths attributed to disasters as a proportion of total population are fairly stable over time. There was a rise due to the Victorian bushfires and associated heatwave in (Figure 2). The strong recent increase in heatwaves, evident in current and projected climate data (Cowan et al. 2014, Perkins-Kirkpatrick et al. 2016), is expected to result in a significant increase in heatwave-related losses including deaths.
The occurrence of hazards over time has been generally stable (Westra et al. 2016). Possible recent exceptions are increasing heatwaves (Cowan et al. 2014; Perkins- Kirkpatrick et al. 2016) and bushfires (Clarke et al. 2013). Given this stability, an increase in the number of disasters over time would likely be the result of more exposure of people or changes in vulnerabilities. When the number of disasters is controlled for population change over time, there are no obvious trends. Similarly, there are no obvious trends in normalised losses.
This all suggests that hazardous areas are neither being avoided nor disproportionately developed. If this was not the case, then the losses and number of disasters trends should reflect that by trending up or down.
One interpretation is that land-use planning and hazard-related building regulations have had no discernible impact on overall hazard losses. The Climate Adaptation Outlook prepared in 2013 by the Department of Industry, Innovation, Climate Change, Science, Research and Tertiary Education came to a similar conclusion. However, for most hazards, there is little in the way of planning to reduce exposure, apart from some flood- and very recently some bushfire-related controls. Building codes have been implemented for cyclones since the late 1970s. However, only part of the building stock in areas hit by cyclones post Cyclone Tracy was built to the new regulations, because much of the building stock pre-dates Cyclone Tracy. As a result, the effects of building regulations may not be well reflected in the cyclone loss record. An alternative explanation for the apparent absence of trends is that the Australian economy has become more resilient and absorbs some of the impacts.
Losses by hazard
Severe storms were the most costly of all disaster types, contributing $49.6 billion or 32 per cent of total losses. Floods (28 per cent of total loss) caused a similar level of damage. Cyclones (19 per cent) and bushfires (17 per cent) also contributed significantly. Together, the combined loss from storms, floods, cyclones and bushfires make up 96 per cent of the total losses from disasters. They also accounted for 93 per cent of the total number of disasters (310 events).
The main differences between the reports concern bushfires and heatwaves. Bushfires (at 17 per cent) now cost almost as much as cyclones (19 per cent) in terms of insurance and total costs, whereas bushfires were far less damaging in the 2001 report at seven per cent of losses. The BTE reported that bushfires resulted in the largest number of fatalities. However, the addition of heatwaves changes the pattern of fatalities as they accounted for half of all deaths over the 1967 to 2013 period. Together, bushfires and heatwaves make 66 per cent, or about two-thirds, of the losses due to deaths and injuries.
Another difference between the reports is that severe storms result in the highest losses in the update, while BTE found that the highest loss came from floods. Severe storms went from 26 per cent of total losses to nearly 32 per cent and floods stayed the same at about 29 per cent.
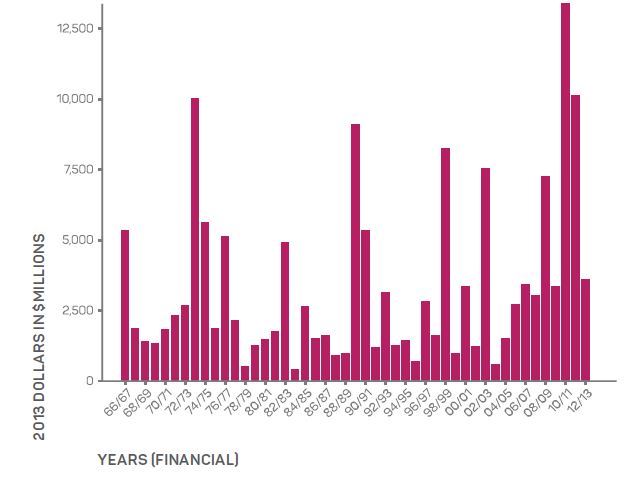
Figure 1: Annual loss from disasters triggered by natural hazards in Australia 1967-2013.
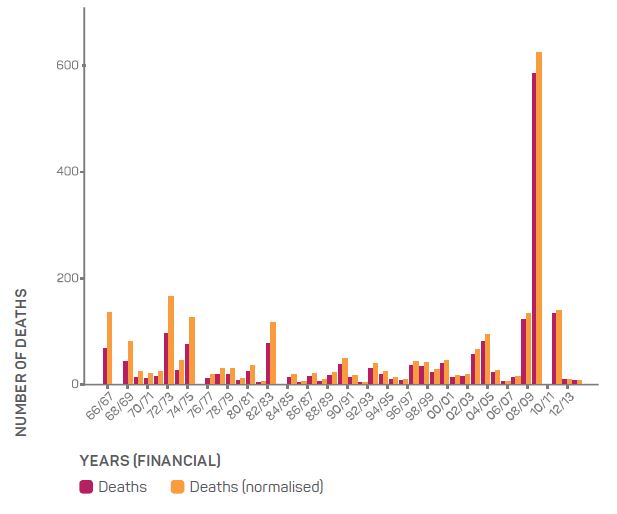
Figure 2: Number of deaths from natural disaster 1967-2013 (raw data and that adjusted for changes in population).
Losses by state
This update project found some differences in the pattern of state-level loss (Figure 3). Over the time series from 1967 to 2013, as with the BTE report, Queensland and New South Wales recorded the highest losses associated with disasters ($49.9 billion and $44.8 billion, respectively) although their order is now reversed, with Queensland recording the largest loss. In the 2001 BTE report, New South Wales was the clear loss leader. Victoria now contributes considerably more to the total losses. New South Wales, Queensland and Victoria account for about 83 per cent of total losses nationally. If only the period since 2000 is analysed, these three states account for about 90 per cent of the loss. For the period since 2000, Victoria is the state with the highest disaster loss (40 per cent of the total).
New South Wales and Queensland accounted for 61 per cent of total disaster costs and 63 per cent of the total number of disasters over the period 1967 to 2013 (Figure 4). Victoria now accounts for 22 per cent of costs, with 15 per cent of frequencies of disasters over the period 1967–2013. Western Australia ranked fourth (5 per cent), followed by the Northern Territory (4 per cent), South Australia (just over 3 per cent), the Australian Capital Territory (3 per cent) and Tasmania (just over 2 per cent).
The main hazards in terms of costs are storms, floods, cyclones and bushfires, with storms and floods dominating (Figure 4).
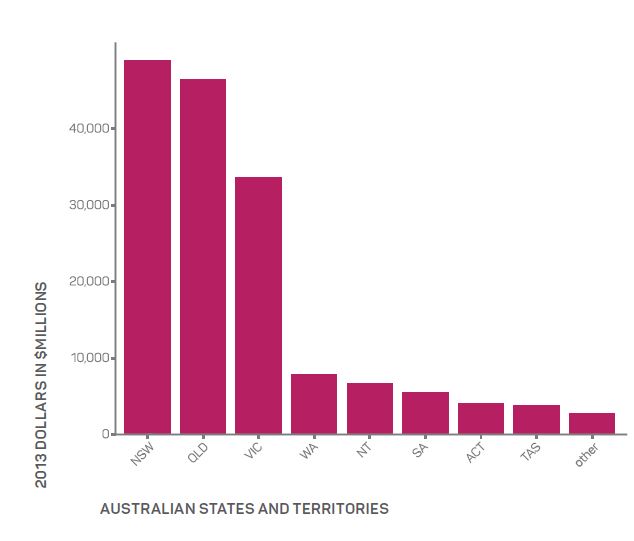
Figure 3: Disaster losses by state and territory 1967-2013. In cases where a single event affected multiple jurisdictions the resultant losses were apportioned between the affected jurisdictions. The cases where this could not be done are included in 'other'.
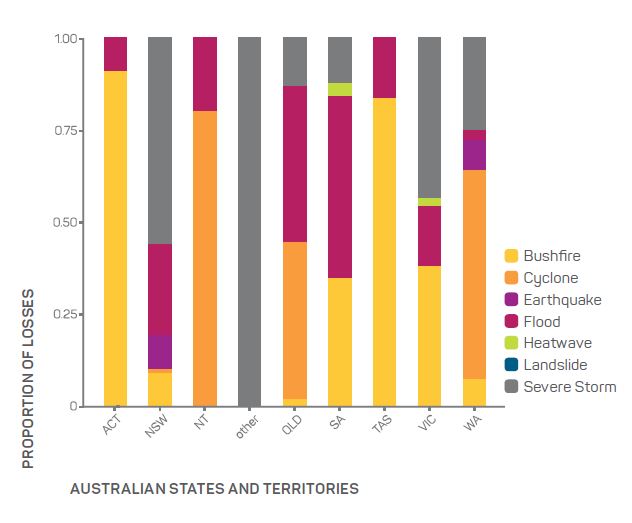
Figure 4: Losses by type of disaster and state and territory 1967–2013. In cases where a single event affected multiple jurisdictions the resultant losses were apportioned between the affected jurisdictions. The cases where this could not be done are included in 'other'.
Gaps and limitations
Despite being an outstanding contribution to the understanding of disasters and natural hazards in Australia, the BTE report had a number of gaps and limitations. These include the absence of heatwaves, no readily accessible metadata, limited normalisation of the dataset and the lack of estimates for indirect and intangible costs.
The update project addressed these major gaps by including metadata and fully normalising the database. However, indirect and intangible losses remain a weak area both for loss identification, data collection, recording and analysis. There is also limited data for heatwaves.
Conclusion and pathways to improvement
The BTE 2001 report has been the only publicly available, comprehensive, national assessment of the economic impacts of disasters in Australia. This update involved developing a new database of Australian disaster losses between 1967 and 2013. Analysis included adjustment of the data for inflation and changes in wealth and population.
The main differences between the findings of the BTE report and the update concern bushfires, heatwaves and the pattern of loss at the state level. Losses from bushfires as a proportion of total disaster losses have more than doubled (to 17 per cent) and now cost almost as much as cyclones. Unlike the BTE report, the update includes heatwaves, which account for half of all fatalities between 1967 and 2013. The BTE report identified that bushfires were the most deadly hazard. Taken together, bushfires and heatwaves now make up nearly two-thirds of the losses from deaths and injuries.
The national time series of loss shows no strong trends: there is no obvious climate change trend, nor is there a trend to show that improved disaster risk reduction has had an impact. However, the state-level pattern has changed, with Victoria now contributing much more to national losses.
There is an unprecedented level of international activity on assessing the effects of disasters and, in particular, on climate-related events as part of climate change adaptation. This activity is a mix of new initiatives and long-established international approaches to improve disaster data and analysis globally. It makes sense to work with these international efforts, drawing on their expertise and recommendations (Handmer, Ladds & Magee 2017).
Within this international context there are issues that require attention to improve understanding and measurement of disaster losses in Australia.
Indirect and intangible losses
The primary long-standing data gaps concern the identification and data collection, recording and analysis of indirect and intangible losses. In 2001, the BTE report argued for ‘a system for the consistent collection of disaster costs’ (p. xix), improved understanding of intangibles, that ‘are at least comparable with direct costs and possibly much larger’ (p. xix). These concerns have yet to be addressed. The value of general health impacts and loss of memorabilia are long-standing research questions in the study of intangibles. A research issue that has assumed increasing importance since the 2001 BTE report is the potential value of ecosystem services. In some disasters, such as severe bushfires, these can constitute a major part of the total loss (e.g. Stephenson, Handmer & Betts 2012).
Research on indirect losses needs to consider the extent of disruption to people’s lives and livelihoods as well as to local economies. This can occur from events with little direct loss. It needs to consider the extent of real indirect loss to a state, as well as the regional or city economy, given that lost production and expenditure are often transferred elsewhere within the same local economy (Handmer, Read & Percovich 2002). These are not new questions. Other questions that are becoming increasingly important concern the ‘just in time’ nature of supply chains and the near total dependence of Australian society and economic activity on uninterrupted electricity supply, which heightens vulnerabilities. Failure of a critical supply chain could cause considerable loss. This should be examined as part of further analysis of indirect losses.
Research on specific hazards
While improvements would be welcome everywhere, research on specific hazards, in particular heatwaves, is required. Heatwaves are increasing as a hazard and are poorly documented other than for fatalities. Current data do not support loss assessments for heatwaves.
There is a higher-level issue of whether disaster loss assessment should be broadened to consider other natural hazards, in particular, drought. The update analysis was organised around standard rapid-onset hazards generally associated with disasters in the global literature. An alternative or complementary approach would be to include other impacts of concern to emergency management agencies: this could include drowning, lightning strikes, etc.
Assessment methods
Assessment methods used in this update are standard well-established methods, albeit with modifications made necessary by data availability and quality. It is recommended that the synthetic approach be developed further as it promises to be of value, especially where data are of uneven quality or missing. Variations of the approach as used in the U.K. and elsewhere have proven to be cost-effective ways of assessing loss and making investment decisions.